
Creating Charts with Google Charts
Google Charts is a free JavaScript library that can create professional graphs and charts using your data.
Google Charts can display:
- Pie Charts
- Bar Charts
- Column Charts
- Line Charts
- Area Charts
In this tutorial you will create your first chart using sample data.
Step 1 - Load the Google Charts Library
Add the following line inside the <head> section of your webpage.
<script src="https://www.gstatic.com/charts/loader.js"></script>
Step 2 - Create a Chart Container
Add a div where the chart will be displayed.
<div id="chart_div"
     style="width:100%; max-width:900px; min-height:320px;">
</div>
Step 3 - Create the Chart
Add the following JavaScript before the closing </body> tag.
<script>

google.charts.load(
    'current',
    {'packages':['corechart']}
);

google.charts.setOnLoadCallback(drawChart);

function drawChart()
{

    var data =
        google.visualization.arrayToDataTable([

        ['Risk Level', 'Count'],

        ['Low',15],

        ['Medium',8],

        ['High',3]

    ]);


    var options = {

        title:'Security Events by Risk Level'

    };


    var chart =
        new google.visualization.PieChart(

        document.getElementById('chart_div')

    );


    chart.draw(data, options);

}

</script>
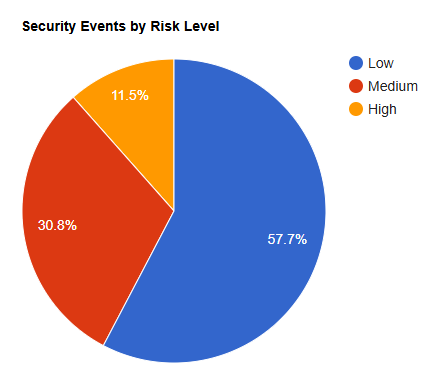
Understanding the Data
Google Charts uses an array to store chart data.
[
 ['Risk Level', 'Count'],

 ['Low',15],

 ['Medium',8],

 ['High',3]
]
The first row contains the headings.
The remaining rows contain the data values.
Changing the Chart Type
The chart type is controlled by:
google.visualization.PieChart
You can change it to:
| Chart | Class |
|---|---|
| Pie Chart | PieChart |
| Column Chart | ColumnChart |
| Bar Chart | BarChart |
| Line Chart | LineChart |
| Area Chart | AreaChart |
Example:
google.visualization.BarChart
will display the same data as a bar chart.
Complete Example
<!DOCTYPE html>

<html>

<head>

    <title>Google Charts Example</title>

    <script src="https://www.gstatic.com/charts/loader.js"></script>

</head>

<body>

<div id="chart_div"
     style="width:100%; max-width:900px; min-height:320px;">
</div>


<script>

google.charts.load(
    'current',
    {'packages':['corechart']}
);

google.charts.setOnLoadCallback(drawChart);

function drawChart()
{

    var data =
        google.visualization.arrayToDataTable([

        ['Risk Level', 'Count'],

        ['Low',15],

        ['Medium',8],

        ['High',3]

    ]);


    var options = {

        title:'Security Events by Risk Level'

    };


    var chart =
        new google.visualization.PieChart(

        document.getElementById('chart_div')

    );


    chart.draw(data, options);

}

</script>

</body>

</html>
Accessibility and data note
Provide the values in an HTML table or concise text summary as well as the chart. Do not rely on colour alone, and give the chart container an accessible name where practical. Google Charts loads JavaScript from Google; use fictional or non-personal summary data only.