# Working with Data

Tutorials for importing, processing, querying and presenting fictional data with PHP, MySQL, JavaScript and charts.

# Importing JSON into MySQL with PHP

Create a MySQL structure, import fictional JSON records with PHP and query the stored data.

# Creating a Security Events Table

In this tutorial, you will create a MySQL table to store security event data imported from a JSON file.

The JSON file contains homes, devices and events. Rather than storing the entire JSON structure, each event will be stored as a separate row in a database table.

This approach makes it easier to search, filter and analyse the data using SQL.

---

## Open phpMyAdmin

Open phpMyAdmin in your browser.

Example:

http://localhost/phpmyadmin/

Select your existing database:

```text
project_db
```

## Create the Security Events Table

Select the **SQL** tab and run:

```sql
CREATE TABLE security_events (

    event_id INT AUTO_INCREMENT PRIMARY KEY,

    device_id VARCHAR(50) NOT NULL,

    device_type VARCHAR(100) NOT NULL,

    room VARCHAR(100) NOT NULL,

    event_timestamp DATETIME NOT NULL,

    event_type VARCHAR(100) NOT NULL,

    data_transmitted VARCHAR(100) NOT NULL,

    severity VARCHAR(20) NOT NULL,

    access_result VARCHAR(20) NOT NULL

);
```

This creates a table capable of storing all event information from the JSON file.

## Review the Table Structure

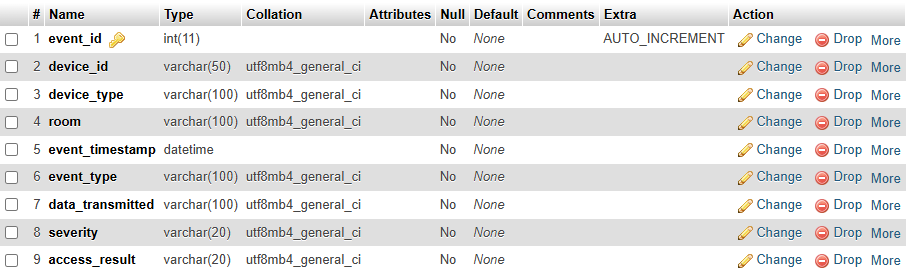
The completed table should contain the following fields:

| Field            | Purpose                          |
| ---------------- | -------------------------------- |
| event_id         | Unique identifier for each event |
| device_id        | Device that generated the event  |
| device_type      | Type of device                   |
| room             | Location of the device           |
| event_timestamp  | Date and time of the event       |
| event_type       | Type of activity                 |
| data_transmitted | Data involved in the event       |
| severity         | Event severity level             |
| access_result    | Result of the event              |

---

## View the Table Structure

Run:

```sql
DESCRIBE security_events;
```

You should see a structure similar to:

| Field            | Type         |
| ---------------- | ------------ |
| event_id         | int          |
| device_id        | varchar(50)  |
| device_type      | varchar(100) |
| room             | varchar(100) |
| event_timestamp  | datetime     |
| event_type       | varchar(100) |
| data_transmitted | varchar(100) |
| severity         | varchar(20)  |
| access_result    | varchar(20)  |

[![](https://mr.napper.au/uploads/images/gallery/2026-06/scaled-1680-/image-1780973678125.png)](https://mr.napper.au/uploads/images/gallery/2026-06/image-1780973678125.png)

## Insert a Test Record

Before importing JSON data, insert a test record to verify the table works correctly.

Run:

```sql
INSERT INTO security_events (

    device_id,
    device_type,
    room,
    event_timestamp,
    event_type,
    data_transmitted,
    severity,
    access_result

)
VALUES (

    'CAM-01',
    'Security Camera',
    'Front Entrance',
    '2026-03-14 02:18:45',
    'motion_detected',
    'video_stream',
    'high',
    'authorised'

);
```

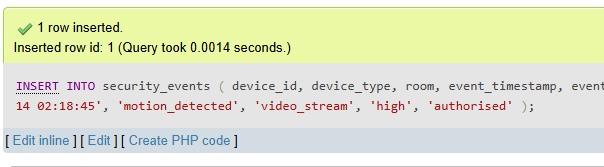
If successful, MySQL will report:

```text
1 row inserted
```

[![](https://mr.napper.au/uploads/images/gallery/2026-06/scaled-1680-/image-1780973720701.png)](https://mr.napper.au/uploads/images/gallery/2026-06/image-1780973720701.png)

## View the Data

Run:

```sql
SELECT * FROM security_events;
```

You should see:

| event_id | device_id | device_type     | room           | event_timestamp     | event_type      | severity |
| -------- | --------- | --------------- | -------------- | ------------------- | --------------- | -------- |
| 1        | CAM-01    | Security Camera | Front Entrance | 2026-03-14 02:18:45 | motion_detected | high     |


## Delete the Test Record

The test record is no longer required.

Run:

```sql
DELETE FROM security_events;
```

Verify the table is empty:

```sql
SELECT * FROM security_events;
```

You should see:

```text
Empty set
```


## Complete SQL Script

```sql
CREATE TABLE security_events (

    event_id INT AUTO_INCREMENT PRIMARY KEY,

    device_id VARCHAR(50) NOT NULL,

    device_type VARCHAR(100) NOT NULL,

    room VARCHAR(100) NOT NULL,

    event_timestamp DATETIME NOT NULL,

    event_type VARCHAR(100) NOT NULL,

    data_transmitted VARCHAR(100) NOT NULL,

    severity VARCHAR(20) NOT NULL,

    access_result VARCHAR(20) NOT NULL

);

INSERT INTO security_events (

    device_id,
    device_type,
    room,
    event_timestamp,
    event_type,
    data_transmitted,
    severity,
    access_result

)
VALUES (

    'CAM-01',
    'Security Camera',
    'Front Entrance',
    '2026-03-14 02:18:45',
    'motion_detected',
    'video_stream',
    'high',
    'authorised'

);

SELECT * FROM security_events;

DELETE FROM security_events;
```

You now have a database table ready to receive event data from a JSON file.

# Importing JSON into MySQL with PHP

This tutorial imports a fictional JSON dataset into MySQL using PHP, PDO, validation and a prepared statement.

Use fictional data only. Do not import real student, staff, account, device or school-security information.

## Project files

Create this structure inside your XAMPP project:

```text
project/
├── includes/
│   └── database.php
├── smart_security_data.json
└── import_json.php
```

`includes/database.php` should create the shared `$pdo` connection used throughout the project. Keep connection details in that one file rather than repeating them on every page.

## Understand the expected data

The fictional JSON file contains homes, devices and nested events. Each event will become one row in `security_events`.

Before importing, identify the fields your code expects. A typical event needs:

- a device identifier and type;
- a room;
- an event timestamp and type;
- the data transmitted;
- severity; and
- the access result.

## Read and decode the JSON

```php
<?php
declare(strict_types=1);

require __DIR__ . '/includes/database.php';

$jsonPath = __DIR__ . '/smart_security_data.json';

if (!is_readable($jsonPath)) {
    exit('The fictional JSON file could not be read.');
}

try {
    $data = json_decode(
        file_get_contents($jsonPath),
        true,
        512,
        JSON_THROW_ON_ERROR
    );
} catch (JsonException $error) {
    exit('The JSON structure is invalid.');
}
```

`JSON_THROW_ON_ERROR` prevents malformed JSON from being treated as valid data.

## Prepare one reusable insert

```php
$insert = $pdo->prepare(
    'INSERT INTO security_events (
        device_id,
        device_type,
        room,
        event_timestamp,
        event_type,
        data_transmitted,
        severity,
        access_result
    ) VALUES (
        :device_id,
        :device_type,
        :room,
        :event_timestamp,
        :event_type,
        :data_transmitted,
        :severity,
        :access_result
    )'
);
```

Preparing the statement once separates the SQL instructions from each row's values.

## Validate and import each event

```php
$allowedSeverities = ['low', 'medium', 'high', 'critical'];
$allowedResults = ['authorised', 'denied', 'blocked'];
$inserted = 0;
$rejected = 0;

$pdo->beginTransaction();

try {
    foreach (($data['devices'] ?? []) as $device) {
        foreach (($device['events'] ?? []) as $event) {
            $deviceId = trim((string) ($device['deviceId'] ?? ''));
            $deviceType = trim((string) ($device['deviceType'] ?? ''));
            $room = trim((string) ($device['room'] ?? ''));
            $timestamp = trim((string) ($event['timestamp'] ?? ''));
            $eventType = trim((string) ($event['eventType'] ?? ''));
            $transmitted = trim((string) ($event['dataTransmitted'] ?? ''));
            $severity = strtolower(trim((string) ($event['severity'] ?? '')));
            $accessResult = strtolower(trim((string) ($event['accessResult'] ?? '')));

            $validTimestamp = DateTime::createFromFormat(
                'Y-m-d H:i:s',
                $timestamp
            ) !== false;

            if (
                $deviceId === '' ||
                $deviceType === '' ||
                $room === '' ||
                $eventType === '' ||
                !$validTimestamp ||
                !in_array($severity, $allowedSeverities, true) ||
                !in_array($accessResult, $allowedResults, true)
            ) {
                $rejected++;
                continue;
            }

            $insert->execute([
                'device_id' => $deviceId,
                'device_type' => $deviceType,
                'room' => $room,
                'event_timestamp' => $timestamp,
                'event_type' => $eventType,
                'data_transmitted' => $transmitted,
                'severity' => $severity,
                'access_result' => $accessResult
            ]);

            $inserted++;
        }
    }

    $pdo->commit();
} catch (Throwable $error) {
    if ($pdo->inTransaction()) {
        $pdo->rollBack();
    }

    exit('The import could not be completed.');
}
```

The transaction prevents a database error from leaving an uncertain partial import. Row validation rejects unsuitable values before storage.

## Report the result

```php
echo '<p>' . $inserted . ' fictional events imported.</p>';
echo '<p>' . $rejected . ' rows rejected.</p>';
```

For a classroom prototype, report useful totals without exposing database errors or connection details to the user.

## Check the import

Confirm that:

- valid events are stored once;
- invalid values are rejected;
- the prepared statement is reused;
- a failed transaction is rolled back;
- the result totals match the database; and
- only fictional data was processed.

# Querying Imported Data with SQL

In this tutorial, you will use SQL queries to analyse the imported data.

---

## View All Events

Open phpMyAdmin and select the:

```text
security_events
```

table.

Run:

```sql
SELECT *
FROM security_events;
```

This displays all imported records.

## Count All Events

To find the total number of events:

```sql
SELECT COUNT(*) AS total_events
FROM security_events;
```

Example result:

| total_events |
| ------------ |
| 3            |

This query is useful for dashboards and reporting.

## Find Critical Events

To display only critical events:

```sql
SELECT *
FROM security_events
WHERE severity = 'critical';
```

Example result:

| device_id | event_type            | severity |
| --------- | --------------------- | -------- |
| CAM-01    | remote_access_attempt | critical |

## Count Events by Severity

Run:

```sql
SELECT
    severity,
    COUNT(*) AS total
FROM security_events
GROUP BY severity;
```

Example result:

| severity | total |
| -------- | ----- |
| critical | 1     |
| high     | 1     |
| medium   | 1     |

This is often used to build dashboard summary cards.

## Find Events from a Specific Device

To display events generated by the security camera:

```sql
SELECT *
FROM security_events
WHERE device_id = 'CAM-01';
```

Example result:

| device_id | event_type            |
| --------- | --------------------- |
| CAM-01    | motion_detected       |
| CAM-01    | remote_access_attempt |

## Count Events Per Device

Run:

```sql
SELECT
    device_id,
    COUNT(*) AS total_events
FROM security_events
GROUP BY device_id;
```

Example result:

| device_id | total_events |
| --------- | ------------ |
| CAM-01    | 2            |
| LOCK-02   | 1            |

This identifies which devices are generating the most activity.

## Find High-Risk Events

To display high and critical events:

```sql
SELECT *
FROM security_events
WHERE severity IN ('high', 'critical');
```

Example result:

| device_id | event_type            | severity |
| --------- | --------------------- | -------- |
| CAM-01    | motion_detected       | high     |
| CAM-01    | remote_access_attempt | critical |

This query could be used to generate security alerts.

## Sort Events by Time

To view the newest events first:

```sql
SELECT *
FROM security_events
ORDER BY event_timestamp DESC;
```

This is commonly used in event logs and monitoring systems.

## Useful Dashboard Queries

### Total Events

```sql
SELECT COUNT(*) AS total_events
FROM security_events;
```

### Critical Events

```sql
SELECT COUNT(*) AS critical_events
FROM security_events
WHERE severity = 'critical';
```

### Device Count

```sql
SELECT COUNT(DISTINCT device_id) AS total_devices
FROM security_events;
```

### Events by Severity

```sql
SELECT
    severity,
    COUNT(*) AS total
FROM security_events
GROUP BY severity;
```

These queries are commonly used when building dashboards.

---

## Complete Practice Queries

```sql
SELECT *
FROM security_events;

SELECT COUNT(*) AS total_events
FROM security_events;

SELECT *
FROM security_events
WHERE severity = 'critical';

SELECT
    severity,
    COUNT(*) AS total
FROM security_events
GROUP BY severity;

SELECT
    device_id,
    COUNT(*) AS total_events
FROM security_events
GROUP BY device_id;

SELECT *
FROM security_events
ORDER BY event_timestamp DESC;
```

You have successfully queried imported JSON data using SQL.

# Building a Security Dashboard Using PHP and MySQL

This standalone example queries fictional security-event data with PDO and presents useful summary and detail output.

A dashboard is meaningful when each output answers a user question. Do not add a statistic or chart merely because it is easy to calculate.

## Connect with PDO

Use the shared connection created in `includes/database.php`:

```php
<?php
declare(strict_types=1);

require __DIR__ . '/includes/database.php';
```

Do not repeat database credentials in the dashboard page.

## Query useful summaries

```php
$totalEvents = (int) $pdo
    ->query('SELECT COUNT(*) FROM security_events')
    ->fetchColumn();

$highRiskEvents = (int) $pdo
    ->query(
        "SELECT COUNT(*)
         FROM security_events
         WHERE severity IN ('high', 'critical')"
    )
    ->fetchColumn();

$deniedEvents = (int) $pdo
    ->query(
        "SELECT COUNT(*)
         FROM security_events
         WHERE access_result IN ('denied', 'blocked')"
    )
    ->fetchColumn();
```

These queries answer three different questions: how much activity exists, how much is high priority, and how often access was prevented.

## Retrieve recent records

```php
$recentStatement = $pdo->query(
    'SELECT
        event_timestamp,
        device_id,
        room,
        event_type,
        severity,
        access_result
     FROM security_events
     ORDER BY event_timestamp DESC
     LIMIT 10'
);

$recentEvents = $recentStatement->fetchAll();
```

Select only the fields needed by the interface.

## Present accessible summary output

```php
<section aria-labelledby="summary-heading">
  <h1 id="summary-heading">Security event summary</h1>

  <div class="summary-grid">
    <article class="card">
      <h2>Total events</h2>
      <p><?= $totalEvents ?></p>
    </article>

    <article class="card">
      <h2>High-priority events</h2>
      <p><?= $highRiskEvents ?></p>
    </article>

    <article class="card">
      <h2>Denied or blocked</h2>
      <p><?= $deniedEvents ?></p>
    </article>
  </div>
</section>
```

Headings and text communicate the meaning without relying on colour alone.

## Present recent events safely

```php
<?php if (!$recentEvents): ?>
  <p>No fictional events are available.</p>
<?php else: ?>
  <div class="table-wrap">
    <table>
      <caption>Ten most recent fictional security events</caption>
      <thead>
        <tr>
          <th scope="col">Time</th>
          <th scope="col">Device</th>
          <th scope="col">Room</th>
          <th scope="col">Event</th>
          <th scope="col">Severity</th>
          <th scope="col">Access result</th>
        </tr>
      </thead>
      <tbody>
        <?php foreach ($recentEvents as $event): ?>
          <tr>
            <td><?= htmlspecialchars($event['event_timestamp']) ?></td>
            <td><?= htmlspecialchars($event['device_id']) ?></td>
            <td><?= htmlspecialchars($event['room']) ?></td>
            <td><?= htmlspecialchars($event['event_type']) ?></td>
            <td><?= htmlspecialchars($event['severity']) ?></td>
            <td><?= htmlspecialchars($event['access_result']) ?></td>
          </tr>
        <?php endforeach; ?>
      </tbody>
    </table>
  </div>
<?php endif; ?>
```

`htmlspecialchars()` prevents stored text from being interpreted as page markup.

## Responsive styling

```css
.summary-grid {
    display: grid;
    grid-template-columns: repeat(auto-fit, minmax(12rem, 1fr));
    gap: 1rem;
}

.table-wrap {
    overflow-x: auto;
}

table {
    width: 100%;
    border-collapse: collapse;
}

th,
td {
    padding: 0.75rem;
    border: 1px solid #cbd5e1;
    text-align: left;
}
```

## Test the dashboard

Confirm that:

- each total matches an independent SQL check;
- an empty database has a clear message;
- text is escaped;
- the table remains usable on a narrow screen;
- headings explain each value; and
- all records are fictional.

# Data Visualisation with Google Charts

Present processed SQL data as pie, bar and line charts using Google Charts.

# Creating Charts with Google Charts

Google Charts is a free JavaScript library that can create professional graphs and charts using your data.

Google Charts can display:

- Pie Charts
- Bar Charts
- Column Charts
- Line Charts
- Area Charts

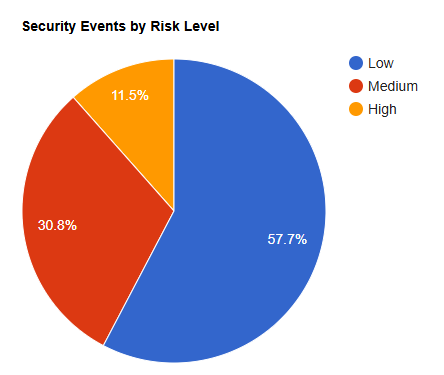
In this tutorial you will create your first chart using sample data.

---

## Step 1 - Load the Google Charts Library

Add the following line inside the `<head>` section of your webpage.

```html
<script src="https://www.gstatic.com/charts/loader.js"></script>
```

---

## Step 2 - Create a Chart Container

Add a `div` where the chart will be displayed.

```html
<div id="chart_div"
     style="width:100%; max-width:900px; min-height:320px;">
</div>
```

---

## Step 3 - Create the Chart

Add the following JavaScript before the closing `</body>` tag.

```html
<script>

google.charts.load(
    'current',
    {'packages':['corechart']}
);

google.charts.setOnLoadCallback(drawChart);

function drawChart()
{

    var data =
        google.visualization.arrayToDataTable([

        ['Risk Level', 'Count'],

        ['Low',15],

        ['Medium',8],

        ['High',3]

    ]);


    var options = {

        title:'Security Events by Risk Level'

    };


    var chart =
        new google.visualization.PieChart(

        document.getElementById('chart_div')

    );


    chart.draw(data, options);

}

</script>
```

[![image-1782085452882.png](https://mr.napper.au/uploads/images/gallery/2026-06/scaled-1680-/image-1782085452882.png)](https://mr.napper.au/uploads/images/gallery/2026-06/image-1782085452882.png)

---

## Understanding the Data

Google Charts uses an array to store chart data.

```javascript
[
 ['Risk Level', 'Count'],

 ['Low',15],

 ['Medium',8],

 ['High',3]
]
```

The first row contains the headings.

The remaining rows contain the data values.

---

## Changing the Chart Type

The chart type is controlled by:

```javascript
google.visualization.PieChart
```

You can change it to:

| Chart | Class |
|------|------|
| Pie Chart | PieChart |
| Column Chart | ColumnChart |
| Bar Chart | BarChart |
| Line Chart | LineChart |
| Area Chart | AreaChart |

Example:

```javascript
google.visualization.BarChart
```

will display the same data as a bar chart.

---

## Complete Example

```html
<!DOCTYPE html>

<html>

<head>

    <title>Google Charts Example</title>

    <script src="https://www.gstatic.com/charts/loader.js"></script>

</head>

<body>

<div id="chart_div"
     style="width:100%; max-width:900px; min-height:320px;">
</div>


<script>

google.charts.load(
    'current',
    {'packages':['corechart']}
);

google.charts.setOnLoadCallback(drawChart);

function drawChart()
{

    var data =
        google.visualization.arrayToDataTable([

        ['Risk Level', 'Count'],

        ['Low',15],

        ['Medium',8],

        ['High',3]

    ]);


    var options = {

        title:'Security Events by Risk Level'

    };


    var chart =
        new google.visualization.PieChart(

        document.getElementById('chart_div')

    );


    chart.draw(data, options);

}

</script>

</body>

</html>
```


## Accessibility and data note

Provide the values in an HTML table or concise text summary as well as the chart. Do not rely on colour alone, and give the chart container an accessible name where practical. Google Charts loads JavaScript from Google; use fictional or non-personal summary data only.

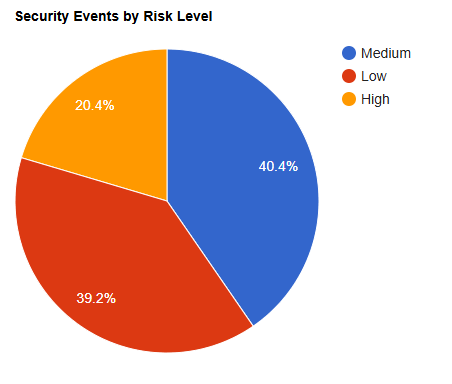
# Pie Charts from SQL Data

In this tutorial, the chart data will come directly from a MySQL database.

The example below uses the `cyber_security_events` table.

---

## Step 1 - Create the SQL Query

The following query counts how many events belong to each risk level.

```sql
SELECT

    risk_level,

    COUNT(*) AS total

FROM cyber_security_events

GROUP BY risk_level;
```

Example result:

| risk_level | total |
|------------|------:|
| Low | 15 |
| Medium | 8 |
| High | 3 |

---

## Step 2 - Retrieve the Data with PHP

```php
<?php

$sql = "

SELECT

    risk_level,

    COUNT(*) AS total

FROM cyber_security_events

GROUP BY risk_level

";

$result = $pdo->query($sql);

$data = [];

while($row = $result->fetch())
{

    $data[] = [

        $row['risk_level'],

        (int)$row['total']

    ];

}

?>
```

---

## Step 3 - Convert the PHP Array to JSON

Google Charts uses JavaScript arrays.

PHP can convert data into JavaScript using:

```php
<?php

echo json_encode($data);

?>
```

---

## Step 4 - Create the Chart

```html
<script>

google.charts.load(
    'current',
    {'packages':['corechart']}
);

google.charts.setOnLoadCallback(drawChart);

function drawChart()
{

    var data = google.visualization.arrayToDataTable([

        ['Risk Level','Count'],

        ...<?php echo json_encode($data); ?>

    ]);

    var options = {

        title:
        'Security Events by Risk Level'

    };

    var chart =

        new google.visualization.PieChart(

            document.getElementById('chart_div')

        );

    chart.draw(data, options);

}

</script>
```

---

## Step 5 - Add the Chart Container

```html
<div id="chart_div"
     style="width:100%; max-width:900px; min-height:320px;">
</div>
```

---

## Complete Example

```php
<?php

$sql = "

SELECT

    risk_level,

    COUNT(*) AS total

FROM cyber_security_events

GROUP BY risk_level

";

$result = $pdo->query($sql);

$data = [];

while($row = $result->fetch())
{

    $data[] = [

        $row['risk_level'],

        (int)$row['total']

    ];

}

?>

<!DOCTYPE html>

<html>

<head>

<script src="https://www.gstatic.com/charts/loader.js"></script>

</head>

<body>

<div id="chart_div"
     style="width:100%; max-width:900px; min-height:320px;">
</div>

<script>

google.charts.load(
    'current',
    {'packages':['corechart']}
);

google.charts.setOnLoadCallback(drawChart);

function drawChart()
{

    var data =

        google.visualization.arrayToDataTable([

        ['Risk Level','Count'],

        ...<?php echo json_encode($data); ?>

    ]);

    var options = {

        title:
        'Security Events by Risk Level'

    };

    var chart =

        new google.visualization.PieChart(

            document.getElementById('chart_div')

        );

    chart.draw(data, options);

}

</script>

</body>

</html>
```

[![](https://mr.napper.au/uploads/images/gallery/2026-06/scaled-1680-/image-1782085720266.png)](https://mr.napper.au/uploads/images/gallery/2026-06/image-1782085720266.png)

## Accessibility and data note

Provide the values in an HTML table or concise text summary as well as the chart. Do not rely on colour alone, and give the chart container an accessible name where practical. Google Charts loads JavaScript from Google; use fictional or non-personal summary data only.

# Bar Charts from SQL Data

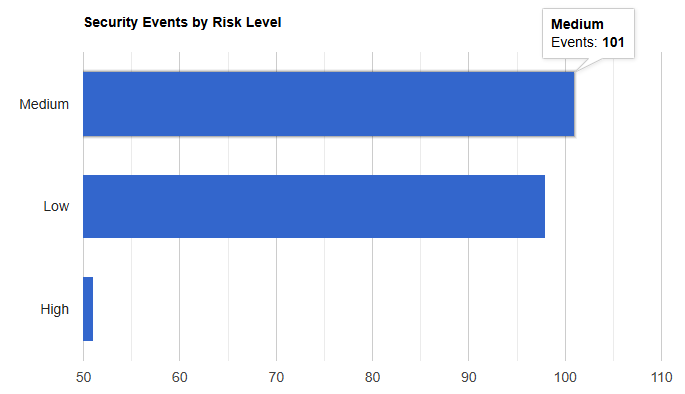
Bar charts are useful for comparing values between categories.

In this tutorial, the number of security events at each risk level will be displayed as a bar chart.

---

## Step 1 - Create the SQL Query

```sql
SELECT

    risk_level,

    COUNT(*) AS total

FROM cyber_security_events

GROUP BY risk_level;
```

Example result:

| risk_level | total |
|------------|------:|
| Low | 15 |
| Medium | 8 |
| High | 3 |

---

## Step 2 - Retrieve the Data with PHP

```php
<?php

$sql = "

SELECT

    risk_level,

    COUNT(*) AS total

FROM cyber_security_events

GROUP BY risk_level

";

$result = $pdo->query($sql);

$data = [];

while($row = $result->fetch())
{

    $data[] = [

        $row['risk_level'],

        (int)$row['total']

    ];

}

?>
```

---

## Step 3 - Create the Chart Container

```html
<div id="chart_div"
     style="width:100%; max-width:900px; min-height:320px;">
</div>
```

---

## Step 4 - Create the Bar Chart

```html
<script>

google.charts.load(
    'current',
    {'packages':['corechart']}
);

google.charts.setOnLoadCallback(drawChart);

function drawChart()
{

    var data =

        google.visualization.arrayToDataTable([

        ['Risk Level','Events'],

        ...<?php echo json_encode($data); ?>

    ]);


    var options = {

        title:'Security Events by Risk Level',

        legend:{position:'none'}

    };


    var chart =

        new google.visualization.BarChart(

            document.getElementById('chart_div')

        );


    chart.draw(data, options);

}

</script>
```

[![image-1782085906217.png](https://mr.napper.au/uploads/images/gallery/2026-06/scaled-1680-/image-1782085906217.png)](https://mr.napper.au/uploads/images/gallery/2026-06/image-1782085906217.png)

## Changing the Chart Type

Only one line of code needs to change.

Pie Chart:

```javascript
new google.visualization.PieChart()
```

Bar Chart:

```javascript
new google.visualization.BarChart()
```

Column Chart:

```javascript
new google.visualization.ColumnChart()
```

Line Chart:

```javascript
new google.visualization.LineChart()
```

---

## Complete Example

```php
<?php

$sql = "

SELECT

    risk_level,

    COUNT(*) AS total

FROM cyber_security_events

GROUP BY risk_level

";

$result = $pdo->query($sql);

$data = [];

while($row = $result->fetch())
{

    $data[] = [

        $row['risk_level'],

        (int)$row['total']

    ];

}

?>

<!DOCTYPE html>

<html>

<head>

<script src="https://www.gstatic.com/charts/loader.js"></script>

</head>

<body>

<div id="chart_div"
     style="width:100%; max-width:900px; min-height:320px;">
</div>


<script>

google.charts.load(
    'current',
    {'packages':['corechart']}
);

google.charts.setOnLoadCallback(drawChart);

function drawChart()
{

    var data =

        google.visualization.arrayToDataTable([

        ['Risk Level','Events'],

        ...<?php echo json_encode($data); ?>

    ]);


    var options = {

        title:'Security Events by Risk Level',

        legend:{position:'none'}

    };


    var chart =

        new google.visualization.BarChart(

            document.getElementById('chart_div')

        );


    chart.draw(data, options);

}

</script>

</body>

</html>
```

## Accessibility and data note

Provide the values in an HTML table or concise text summary as well as the chart. Do not rely on colour alone, and give the chart container an accessible name where practical. Google Charts loads JavaScript from Google; use fictional or non-personal summary data only.

# Line Charts from SQL Data

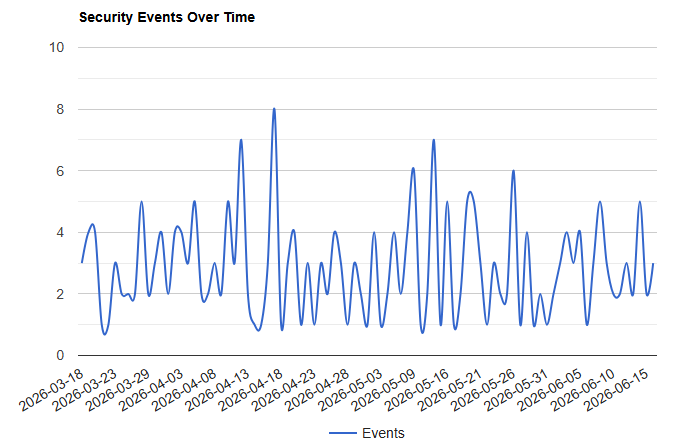
Line charts are used to display trends and changes over time.

In this tutorial, the number of security events per day will be displayed using a line chart.

---

## Step 1 - Create the SQL Query

The following query counts the number of events recorded each day.

```sql
SELECT

    DATE(event_timestamp) AS event_date,

    COUNT(*) AS total

FROM cyber_security_events

GROUP BY DATE(event_timestamp)

ORDER BY event_date;
```

Example result:

| event_date | total |
|------------|------:|
| 2026-06-01 | 12 |
| 2026-06-02 | 18 |
| 2026-06-03 | 9 |
| 2026-06-04 | 15 |

---

## Step 2 - Retrieve the Data with PHP

```php
<?php

$sql = "

SELECT

    DATE(event_timestamp) AS event_date,

    COUNT(*) AS total

FROM cyber_security_events

GROUP BY DATE(event_timestamp)

ORDER BY event_date

";

$result = $pdo->query($sql);

$data = [];

while($row = $result->fetch())
{

    $data[] = [

        $row['event_date'],

        (int)$row['total']

    ];

}

?>
```

---

## Step 3 - Create the Chart Container

```html
<div id="chart_div"
     style="width:100%; max-width:900px; min-height:320px;">
</div>
```

---

## Step 4 - Create the Line Chart

```html
<script>

google.charts.load(
    'current',
    {'packages':['corechart']}
);

google.charts.setOnLoadCallback(drawChart);

function drawChart()
{

    var data =

        google.visualization.arrayToDataTable([

        ['Date','Events'],

        ...<?php echo json_encode($data); ?>

    ]);


    var options = {

        title:'Security Events Over Time',

        curveType:'function',

        legend:{position:'bottom'}

    };


    var chart =

        new google.visualization.LineChart(

            document.getElementById('chart_div')

        );


    chart.draw(data, options);

}

</script>
```

[![](https://mr.napper.au/uploads/images/gallery/2026-06/scaled-1680-/image-1782086063395.png)](https://mr.napper.au/uploads/images/gallery/2026-06/image-1782086063395.png)

---

## Understanding the Chart

The horizontal axis displays:

```text
Date
```

The vertical axis displays:

```text
Number of Security Events
```

This makes it easier to identify:

- Busy periods
- Trends over time
- Sudden increases in activity
- Patterns in the data

---

## Complete Example

```php
<?php

$sql = "

SELECT

    DATE(event_timestamp) AS event_date,

    COUNT(*) AS total

FROM cyber_security_events

GROUP BY DATE(event_timestamp)

ORDER BY event_date

";

$result = $pdo->query($sql);

$data = [];

while($row = $result->fetch())
{

    $data[] = [

        $row['event_date'],

        (int)$row['total']

    ];

}

?>

<!DOCTYPE html>

<html>

<head>

<script src="https://www.gstatic.com/charts/loader.js"></script>

</head>

<body>

<div id="chart_div"
     style="width:100%; max-width:900px; min-height:320px;">
</div>


<script>

google.charts.load(
    'current',
    {'packages':['corechart']}
);

google.charts.setOnLoadCallback(drawChart);

function drawChart()
{

    var data =

        google.visualization.arrayToDataTable([

        ['Date','Events'],

        ...<?php echo json_encode($data); ?>

    ]);


    var options = {

        title:'Security Events Over Time',

        curveType:'function',

        legend:{position:'bottom'}

    };


    var chart =

        new google.visualization.LineChart(

            document.getElementById('chart_div')

        );


    chart.draw(data, options);

}

</script>

</body>

</html>
```

## Accessibility and data note

Provide the values in an HTML table or concise text summary as well as the chart. Do not rely on colour alone, and give the chart container an accessible name where practical. Google Charts loads JavaScript from Google; use fictional or non-personal summary data only.

# Working with APIs

Create PHP JSON APIs and retrieve database records through focused endpoints.

# Creating a Simple JSON API with PHP

In this tutorial, you will create a simple API using PHP.

The API will return JSON data when visited in a browser.

This is the same type of data format used by many real-world APIs.

---

## Project Structure

Create a folder called:

```text
api-demo
```

Inside the folder place:

```text
api-demo
├── api.php
└── smart_security_data.json
```

---

## Create the API File

Create:

```text
api.php
```

Add:

```php
<?php

header(
    "Content-Type: application/json"
);

echo file_get_contents(
    "smart_security_data.json"
);

?>
```

Save the file.

---

## Understanding the Code

This line tells the browser that JSON data is being returned:

```php
header(
    "Content-Type: application/json"
);
```

This line reads the JSON file:

```php
file_get_contents(
    "smart_security_data.json"
);
```

This line sends the JSON data to the browser:

```php
echo file_get_contents(
    "smart_security_data.json"
);
```

---

## Test the API

Open:

```text
http://localhost/api-demo/api.php
```

You should see:

```json
{
  "homeId": "GC-HOME-014",
  "location": "Gold Coast"
}
```

along with the rest of the JSON data.

## Test the API in a New Browser Tab

Notice that the URL now behaves like a data source.

Instead of displaying a webpage, it returns structured JSON data.

This is the same concept used by many modern APIs.

Example:

```text
https://example.com/api/users
https://example.com/api/products
https://example.com/api/weather
```

---


## Complete API File

```php
<?php

header(
    "Content-Type: application/json"
);

echo file_get_contents(
    "smart_security_data.json"
);

?>
```

You have successfully created a JSON API using PHP.

# Reading API Data with JavaScript

The API returns JSON data when visited in a browser.

In this tutorial, you will use JavaScript to read data from the API and display it on a webpage.

---

## Project Structure

Your project should contain:

```text
api-demo
├── api.php
├── index.html
└── smart_security_data.json
```

---

## Create the HTML Page

Create:

```text
index.html
```

Add:

```html
<!DOCTYPE html>
<html>
<head>
    <title>API Demo</title>
</head>
<body>

<h1>API Dashboard</h1>

<div id="output"></div>

<script>

</script>

</body>
</html>
```

Save the file.

---

## Read the API

Inside the `<script>` tags add:

```javascript
fetch("api.php")
    .then(response => response.json())
    .then(data => {

        console.log(data);

    });
```

Save the file.

---

## Test the API Request

Open:

```text
http://localhost/api-demo/
```

Press:

```text
F12
```

Open the **Console** tab.

You should see the JSON object displayed.

## Display the Home Information

Replace:

```javascript
console.log(data);
```

with:

```javascript
document.getElementById(
    "output"
).innerHTML = `

    <p>
        <strong>Home ID:</strong>
        ${data.homeId}
    </p>

    <p>
        <strong>Location:</strong>
        ${data.location}
    </p>

`;
```

Refresh the page.

You should see:

```text
Home ID: GC-HOME-014

Location: Gold Coast
```

## Display Device Information

Replace the existing code with:

```javascript
let html = `

    <h2>Devices</h2>

    <table border="1">

        <tr>
            <th>Device ID</th>
            <th>Device Type</th>
            <th>Room</th>
        </tr>

`;

data.devices.forEach(device => {

    html += `

        <tr>
            <td>${device.deviceId}</td>
            <td>${device.deviceType}</td>
            <td>${device.room}</td>
        </tr>

    `;

});

html += "</table>";

document.getElementById(
    "output"
).innerHTML = html;
```

Refresh the page.

You should now see a table of devices.

## Why Use an API?

Previously, the data was loaded directly from:

```javascript
fetch("smart_security_data.json")
```

Now the data is loaded from:

```javascript
fetch("api.php")
```

This means the data can be:

* Generated dynamically
* Stored in a database
* Updated automatically
* Filtered before being sent

The webpage does not need to know where the data comes from. It only needs the JSON returned by the API.

---

## Complete Page

```html
<!DOCTYPE html>
<html>
<head>
    <title>API Demo</title>
</head>
<body>

<h1>API Dashboard</h1>

<div id="output"></div>

<script>

fetch("api.php")
    .then(response => response.json())
    .then(data => {

        let html = `

            <h2>Devices</h2>

            <table border="1">

                <tr>
                    <th>Device ID</th>
                    <th>Device Type</th>
                    <th>Room</th>
                </tr>

        `;

        data.devices.forEach(device => {

            html += `

                <tr>
                    <td>${device.deviceId}</td>
                    <td>${device.deviceType}</td>
                    <td>${device.room}</td>
                </tr>

            `;

        });

        html += "</table>";

        document.getElementById(
            "output"
        ).innerHTML = html;

    });

</script>

</body>
</html>
```

You have successfully consumed data from an API using JavaScript.

# Creating a Database-Driven API with PHP and MySQL

This tutorial creates a read-only JSON endpoint using PHP, PDO and fictional database records.

An API should return only the data needed for its stated purpose. Do not expose password hashes, session data, personal information or unnecessary database fields.

## Create the endpoint

Create `api/events.php`:

```php
<?php
declare(strict_types=1);

require __DIR__ . '/../includes/database.php';

header('Content-Type: application/json; charset=utf-8');
header('Cache-Control: no-store');

try {
    $statement = $pdo->query(
        'SELECT
            event_id,
            event_timestamp,
            device_id,
            room,
            event_type,
            severity,
            access_result
         FROM security_events
         ORDER BY event_timestamp DESC
         LIMIT 100'
    );

    $events = $statement->fetchAll();

    echo json_encode(
        [
            'ok' => true,
            'count' => count($events),
            'events' => $events
        ],
        JSON_THROW_ON_ERROR | JSON_UNESCAPED_SLASHES
    );
} catch (Throwable $error) {
    http_response_code(500);

    echo json_encode([
        'ok' => false,
        'error' => 'The fictional event data is unavailable.'
    ]);
}
```

The endpoint:

- uses the shared PDO connection;
- selects only the required fields;
- limits the response size;
- returns a predictable object; and
- avoids exposing database error details.

## Test the response

Open the endpoint through XAMPP:

```text
http://localhost/project/api/events.php
```

A successful response should have this shape:

```json
{
  "ok": true,
  "count": 2,
  "events": [
    {
      "event_id": 14,
      "event_timestamp": "2026-06-14 20:57:06",
      "device_id": "CAM-01",
      "room": "Science Lab",
      "event_type": "failed_login",
      "severity": "medium",
      "access_result": "denied"
    }
  ]
}
```

The values are fictional. Your live response will reflect the current database.

## Important boundary

This example is a public, read-only classroom endpoint. A production API may also require authentication, authorisation, pagination, rate limiting, audit logging and a documented privacy purpose.

## Check

- The endpoint returns valid JSON.
- The response uses an appropriate HTTP status when processing fails.
- No credentials, password hashes or unnecessary fields are exposed.
- The response is limited to a reasonable number of records.
- All records are fictional.

# Creating API Endpoints for Specific Data

Focused endpoints return the smallest useful result for a particular user need. This tutorial adds filtered and summary endpoints using PDO and fictional records.

## Endpoint for one severity

Create `api/events-by-severity.php`:

```php
<?php
declare(strict_types=1);

require __DIR__ . '/../includes/database.php';

header('Content-Type: application/json; charset=utf-8');
header('Cache-Control: no-store');

$allowed = ['low', 'medium', 'high', 'critical'];
$severity = strtolower(trim($_GET['severity'] ?? ''));

if (!in_array($severity, $allowed, true)) {
    http_response_code(400);
    echo json_encode([
        'ok' => false,
        'error' => 'Choose low, medium, high or critical.'
    ]);
    exit;
}

$statement = $pdo->prepare(
    'SELECT
        event_id,
        event_timestamp,
        device_id,
        room,
        event_type,
        severity
     FROM security_events
     WHERE severity = :severity
     ORDER BY event_timestamp DESC
     LIMIT 100'
);

$statement->execute(['severity' => $severity]);
$events = $statement->fetchAll();

echo json_encode([
    'ok' => true,
    'filter' => ['severity' => $severity],
    'count' => count($events),
    'events' => $events
]);
```

Test it with a fictional category:

```text
http://localhost/project/api/events-by-severity.php?severity=high
```

The allow-list rejects unexpected values and the prepared statement keeps the supplied value separate from the SQL.

## Endpoint for summary totals

Create `api/event-summary.php`:

```php
<?php
declare(strict_types=1);

require __DIR__ . '/../includes/database.php';

header('Content-Type: application/json; charset=utf-8');
header('Cache-Control: no-store');

$statement = $pdo->query(
    'SELECT severity, COUNT(*) AS total
     FROM security_events
     GROUP BY severity
     ORDER BY severity'
);

$rows = $statement->fetchAll();

$summary = [];

foreach ($rows as $row) {
    $summary[] = [
        'severity' => $row['severity'],
        'total' => (int) $row['total']
    ];
}

echo json_encode([
    'ok' => true,
    'summary' => $summary
]);
```

This endpoint returns processed information rather than every event record. It can support an accessible table or chart.

## Choose endpoints from user needs

Useful endpoints might answer:

- Which fictional events require urgent review?
- How many events occurred in each category?
- Which events belong to a selected device?
- How has the event count changed over time?

Avoid creating many endpoints that expose the same unnecessary fields.

## Check

- Invalid filters return HTTP 400 and a clear JSON error.
- User-supplied values are validated and passed through prepared statements.
- Totals are cast to numbers before encoding.
- Responses contain only the required fields.
- No personal information or credentials are exposed.
- All demonstration records are fictional.

# Working with JSON Data in JavaScript

Load, interpret and present nested fictional JSON data with JavaScript.

# Loading JSON Data with JavaScript

In this tutorial, you will load data from a JSON file and display it on a webpage using JavaScript.

The JSON file contains information about a smart home, including devices and security events.

---

## Create the Project Files

Create a new folder called:

```text
json-demo
```

Inside the folder create:

```text
index.html
smart_security_data.json
```

Copy the JSON file into the project folder.

Your folder structure should look like:

```text
json-demo
├── index.html
└── smart_security_data.json
```

## Create the HTML Page

Open:

```text
index.html
```

Add the following code:

```html
<!DOCTYPE html>
<html>
<head>
    <title>JSON Demo</title>
</head>
<body>

<h1>Smart Home Dashboard</h1>

<div id="output"></div>

<script src="script.js"></script>

</body>
</html>
```

Save the file.

---

## Create the JavaScript File

Create a new file called:

```text
script.js
```

Your folder should now look like:

```text
json-demo
├── index.html
├── script.js
└── smart_security_data.json
```

## Load the JSON File

Open:

```text
script.js
```

Add:

```javascript
fetch("smart_security_data.json")
    .then(response => response.json())
    .then(data => {

        console.log(data);

    });
```

Save the file.

This code loads the JSON file and converts it into a JavaScript object.

---

## Open Developer Tools

Open:

```text
index.html
```

in your browser.

Press:

```text
F12
```

and select the **Console** tab.

You should see the JSON data displayed.

[![](https://mr.napper.au/uploads/images/gallery/2026-06/scaled-1680-/image-1780915521847.png)](https://mr.napper.au/uploads/images/gallery/2026-06/image-1780915521847.png)

## Display the Home Information

Replace the contents of:

```javascript
.then(data => {

});
```

with:

```javascript
.then(data => {

    document.getElementById("output").innerHTML = `
        <p><strong>Home ID:</strong> ${data.homeId}</p>
        <p><strong>Location:</strong> ${data.location}</p>
    `;

});
```

Save the file.

Refresh the page.

You should now see:

```text
Home ID: GC-HOME-014
Location: Gold Coast
```


## Display the Devices

Update the code:

```javascript
fetch("smart_security_data.json")
    .then(response => response.json())
    .then(data => {

        let html = `
            <p><strong>Home ID:</strong> ${data.homeId}</p>
            <p><strong>Location:</strong> ${data.location}</p>

            <h2>Devices</h2>
            <ul>
        `;

        data.devices.forEach(device => {

            html += `
                <li>
                    ${device.deviceId}
                    (${device.deviceType})
                </li>
            `;

        });

        html += "</ul>";

        document.getElementById("output").innerHTML = html;

    });
```

Refresh the page.

You should now see:

```text
Home ID: GC-HOME-014
Location: Gold Coast

Devices

CAM-01 (Security Camera)
LOCK-02 (Smart Door Lock)
```

## Complete JavaScript File

```javascript
fetch("smart_security_data.json")
    .then(response => response.json())
    .then(data => {

        let html = `
            <p><strong>Home ID:</strong> ${data.homeId}</p>
            <p><strong>Location:</strong> ${data.location}</p>

            <h2>Devices</h2>
            <ul>
        `;

        data.devices.forEach(device => {

            html += `
                <li>
                    ${device.deviceId}
                    (${device.deviceType})
                </li>
            `;

        });

        html += "</ul>";

        document.getElementById("output").innerHTML = html;

    });
```

You have successfully loaded a JSON file and displayed data using JavaScript.

# Displaying JSON Data in a Table

In this tutorial, you will display the device data in an HTML table using JavaScript.

---

## Current Project Structure

Your project should contain:

```text
json-demo
├── index.html
├── script.js
└── smart_security_data.json
```

---

## Create a Table Container

Open:

```text
index.html
```

Update the page so it contains:

```html
<!DOCTYPE html>
<html>
<head>
    <title>JSON Demo</title>
</head>
<body>

<h1>Smart Home Dashboard</h1>

<div id="output"></div>

<script src="script.js"></script>

</body>
</html>
```

The table will be generated inside the `output` div.

---

## Create the Table Structure

Open:

```text
script.js
```

Replace the previous code with:

```javascript
fetch("smart_security_data.json")
    .then(response => response.json())
    .then(data => {

        let html = `
            <h2>Devices</h2>

            <table border="1">

                <tr>
                    <th>Device ID</th>
                    <th>Device Type</th>
                    <th>Room</th>
                </tr>
        `;

        data.devices.forEach(device => {

            html += `
                <tr>
                    <td>${device.deviceId}</td>
                    <td>${device.deviceType}</td>
                    <td>${device.room}</td>
                </tr>
            `;

        });

        html += "</table>";

        document.getElementById("output").innerHTML = html;

    });
```

Save the file.

---

## View the Results

Open:

```text
http://localhost/json-demo/
```

You should see:

| Device ID | Device Type     | Room           |
| --------- | --------------- | -------------- |
| CAM-01    | Security Camera | Front Entrance |
| LOCK-02   | Smart Door Lock | Back Door      |

## Add Basic Styling

The table works, but it looks very plain.

Add the following CSS inside the `<head>` section of `index.html`:

```html
<style>

table {
    border-collapse: collapse;
    width: 100%;
}

th,
td {
    border: 1px solid #cccccc;
    padding: 10px;
    text-align: left;
}

th {
    background-color: #f2f2f2;
}

</style>
```

Refresh the page.

The table should now be easier to read.

## Display the Home Information Above the Table

Update the start of the HTML string:

```javascript
let html = `
    <p>
        <strong>Home ID:</strong>
        ${data.homeId}
    </p>

    <p>
        <strong>Location:</strong>
        ${data.location}
    </p>

    <h2>Devices</h2>

    <table border="1">

        <tr>
            <th>Device ID</th>
            <th>Device Type</th>
            <th>Room</th>
        </tr>
`;
```

The page should now display:

```text
Home ID: GC-HOME-014
Location: Gold Coast

Devices
```

followed by the table.

[![](https://mr.napper.au/uploads/images/gallery/2026-06/scaled-1680-/image-1780916592738.png)](https://mr.napper.au/uploads/images/gallery/2026-06/image-1780916592738.png)

## Complete JavaScript File

```javascript
fetch("smart_security_data.json")
    .then(response => response.json())
    .then(data => {

        let html = `
            <p>
                <strong>Home ID:</strong>
                ${data.homeId}
            </p>

            <p>
                <strong>Location:</strong>
                ${data.location}
            </p>

            <h2>Devices</h2>

            <table border="1">

                <tr>
                    <th>Device ID</th>
                    <th>Device Type</th>
                    <th>Room</th>
                </tr>
        `;

        data.devices.forEach(device => {

            html += `
                <tr>
                    <td>${device.deviceId}</td>
                    <td>${device.deviceType}</td>
                    <td>${device.room}</td>
                </tr>
            `;

        });

        html += "</table>";

        document.getElementById("output").innerHTML = html;

    });
```

You have successfully loaded JSON data and displayed it in an HTML table.

# Displaying Nested Event Data from JSON

In this tutorial, you will work with nested JSON data by displaying the security events associated with each device.

The JSON file contains devices, and each device contains its own list of events.

---

## Understanding the JSON Structure

The JSON file contains:

```text id="xtom1s"
Home
 └ Devices
     └ Events
```

Example:

```json id="g5ljhj"
{
    "deviceId": "CAM-01",
    "events": [
        {
            "eventType": "motion_detected"
        }
    ]
}
```

To display the events, we need to loop through:

1. The devices
2. The events within each device

---

## Create an Events Table

Open:

```text id="x6y2qy"
script.js
```

Replace the previous code with:

```javascript id="s87r9y"
fetch("smart_security_data.json")
    .then(response => response.json())
    .then(data => {

        let html = `
            <h2>Security Events</h2>

            <table border="1">

                <tr>
                    <th>Device ID</th>
                    <th>Event Type</th>
                    <th>Severity</th>
                </tr>
        `;

        data.devices.forEach(device => {

            device.events.forEach(event => {

                html += `
                    <tr>
                        <td>${device.deviceId}</td>
                        <td>${event.eventType}</td>
                        <td>${event.severity}</td>
                    </tr>
                `;

            });

        });

        html += "</table>";

        document.getElementById("output").innerHTML = html;

    });
```

---

## View the Results

Open:

```text id="nmb2d0"
http://localhost/json-demo/
```

You should see a table similar to:

| Device ID | Event Type            | Severity |
| --------- | --------------------- | -------- |
| CAM-01    | motion_detected       | high     |
| CAM-01    | remote_access_attempt | critical |
| LOCK-02   | unlock_attempt        | medium   |

## Add Additional Event Information

The JSON file contains more information about each event.

Each event includes:

```text id="c4vdvx"
timestamp
eventType
dataTransmitted
severity
accessResult
```

Update the table headings:

```javascript id="vkp5wz"
<tr>
    <th>Device ID</th>
    <th>Timestamp</th>
    <th>Event Type</th>
    <th>Severity</th>
    <th>Access Result</th>
</tr>
```

---

## Update the Table Rows

Replace the existing row code with:

```javascript id="fphmdh"
html += `
    <tr>
        <td>${device.deviceId}</td>
        <td>${event.timestamp}</td>
        <td>${event.eventType}</td>
        <td>${event.severity}</td>
        <td>${event.accessResult}</td>
    </tr>
`;
```

Refresh the page.

The table should now display more detailed event information.

[![](https://mr.napper.au/uploads/images/gallery/2026-06/scaled-1680-/image-1780917222478.png)](https://mr.napper.au/uploads/images/gallery/2026-06/image-1780917222478.png)

## Display the Device Type

Sometimes multiple devices may generate events.

Add another column heading:

```javascript id="o3ijwv"
<th>Device Type</th>
```

Update the row:

```javascript id="3lhhqa"
<td>${device.deviceType}</td>
```

Your table will now identify which type of device generated each event.

---

## Complete JavaScript File

```javascript id="r0aj72"
fetch("smart_security_data.json")
    .then(response => response.json())
    .then(data => {

        let html = `
            <h2>Security Events</h2>

            <table border="1">

                <tr>
                    <th>Device ID</th>
                    <th>Device Type</th>
                    <th>Timestamp</th>
                    <th>Event Type</th>
                    <th>Severity</th>
                    <th>Access Result</th>
                </tr>
        `;

        data.devices.forEach(device => {

            device.events.forEach(event => {

                html += `
                    <tr>
                        <td>${device.deviceId}</td>
                        <td>${device.deviceType}</td>
                        <td>${event.timestamp}</td>
                        <td>${event.eventType}</td>
                        <td>${event.severity}</td>
                        <td>${event.accessResult}</td>
                    </tr>
                `;

            });

        });

        html += "</table>";

        document.getElementById("output").innerHTML = html;

    });
```

---

## What Happened?

devices
```

In this tutorial, you looped through:

```javascript id="rjlwmz"
data.devices
```

and then:

```javascript id="0xkbxw"
device.events
```

This is known as a nested loop and is commonly used when working with JSON files and APIs.

You have successfully displayed nested JSON data in a table.

# Creating a Security Dashboard from JSON Data

In this tutorial, you will create a simple dashboard that summarises the data and highlights important security information.

The dashboard will display:

* Total Devices
* Total Events
* Critical Events
* High Severity Events
* Medium Severity Events

Using the sample JSON file, there are 2 devices and 3 events, including one critical event.

---

## Create a Dashboard Section

Open:

```text
script.js
```

Replace the existing code with:

```javascript
fetch("smart_security_data.json")
    .then(response => response.json())
    .then(data => {

        let totalDevices = data.devices.length;

        let totalEvents = 0;
        let criticalEvents = 0;
        let highEvents = 0;
        let mediumEvents = 0;

        data.devices.forEach(device => {

            device.events.forEach(event => {

                totalEvents++;

                if (event.severity === "critical") {
                    criticalEvents++;
                }

                if (event.severity === "high") {
                    highEvents++;
                }

                if (event.severity === "medium") {
                    mediumEvents++;
                }

            });

        });

    });
```

This code calculates summary statistics from the JSON data.

---

## Create Dashboard Cards

Below the calculations, add:

```javascript
let html = `
    <h2>Security Dashboard</h2>

    <div class="card">
        <h3>Total Devices</h3>
        <p>${totalDevices}</p>
    </div>

    <div class="card">
        <h3>Total Events</h3>
        <p>${totalEvents}</p>
    </div>

    <div class="card">
        <h3>Critical Events</h3>
        <p>${criticalEvents}</p>
    </div>

    <div class="card">
        <h3>High Events</h3>
        <p>${highEvents}</p>
    </div>

    <div class="card">
        <h3>Medium Events</h3>
        <p>${mediumEvents}</p>
    </div>
`;
```

---

## Display the Dashboard

Add:

```javascript
document.getElementById("output").innerHTML = html;
```

The completed code should now display the dashboard cards.

---

## Add Dashboard Styling

Open:

```text
index.html
```

Inside the `<style>` section, add:

```css
.card {
    border: 1px solid #cccccc;
    border-radius: 8px;
    padding: 15px;
    margin-bottom: 10px;
}

.card h3 {
    margin-top: 0;
}
```

Save the file.

---

## View the Dashboard

Open:

```text
http://localhost/json-demo/
```

Using the sample JSON file, you should see something similar to:

```text
Security Dashboard

Total Devices: 2
Total Events: 3
Critical Events: 1
High Events: 1
Medium Events: 1
```

## Display the Event Table Below the Dashboard

The dashboard is useful, but users often want to see the detailed events as well.

Add the following code underneath the dashboard cards:

```javascript
html += `
    <h2>Security Events</h2>

    <table border="1">

        <tr>
            <th>Device ID</th>
            <th>Event Type</th>
            <th>Severity</th>
        </tr>
`;
```

---

## Add Event Rows

Add:

```javascript
data.devices.forEach(device => {

    device.events.forEach(event => {

        html += `
            <tr>
                <td>${device.deviceId}</td>
                <td>${event.eventType}</td>
                <td>${event.severity}</td>
            </tr>
        `;

    });

});
```

Close the table:

```javascript
html += "</table>";
```

---

## Complete JavaScript File

```javascript
fetch("smart_security_data.json")
    .then(response => response.json())
    .then(data => {

        let totalDevices = data.devices.length;

        let totalEvents = 0;
        let criticalEvents = 0;
        let highEvents = 0;
        let mediumEvents = 0;

        data.devices.forEach(device => {

            device.events.forEach(event => {

                totalEvents++;

                if (event.severity === "critical") criticalEvents++;
                if (event.severity === "high") highEvents++;
                if (event.severity === "medium") mediumEvents++;

            });

        });

        let html = `
            <h2>Security Dashboard</h2>

            <div class="card">
                <h3>Total Devices</h3>
                <p>${totalDevices}</p>
            </div>

            <div class="card">
                <h3>Total Events</h3>
                <p>${totalEvents}</p>
            </div>

            <div class="card">
                <h3>Critical Events</h3>
                <p>${criticalEvents}</p>
            </div>

            <div class="card">
                <h3>High Events</h3>
                <p>${highEvents}</p>
            </div>

            <div class="card">
                <h3>Medium Events</h3>
                <p>${mediumEvents}</p>
            </div>

            <h2>Security Events</h2>

            <table border="1">

                <tr>
                    <th>Device ID</th>
                    <th>Event Type</th>
                    <th>Severity</th>
                </tr>
        `;

        data.devices.forEach(device => {

            device.events.forEach(event => {

                html += `
                    <tr>
                        <td>${device.deviceId}</td>
                        <td>${event.eventType}</td>
                        <td>${event.severity}</td>
                    </tr>
                `;

            });

        });

        html += "</table>";

        document.getElementById("output").innerHTML = html;

    });
```

You now have a dashboard that summarises JSON data and displays detailed event information underneath.

# Importing CSV into MySQL with PHP

Build a secure administrator-only workflow that validates fictional CSV data and stores acceptable rows in MySQL.

# Understanding CSV Data

CSV means comma-separated values. Each line is a record and each position represents a field.

~~~csv
match_id,team_name,wins,losses
M001,Fictional Falcons,4,1
M002,Sample Sharks,3,2
~~~

The first row is a header. Quoted fields may contain commas, so do not process CSV with `explode(",")`; use `fgetcsv()`.

## Inspect before importing

Identify headers, data types, required fields, allowed ranges, unique identifiers, missing values and any fields that relate to other tables.

Treat every upload as untrusted input. A file being supplied with a task does not remove the need for validation.

## Check

- [ ] Headers have meaning and match expected fields.
- [ ] Every row has the expected number of columns.
- [ ] Numeric and identifier rules are documented.
- [ ] All classroom records are fictional.

# Designing a MySQL Table from a CSV

Design the destination table from the meaning of the data, not merely its appearance in a spreadsheet.

| CSV field | MySQL type | Rule |
| --- | --- | --- |
| match_id | VARCHAR(20) | unique and required |
| team_name | VARCHAR(100) | required |
| wins | INT | zero or greater |
| losses | INT | zero or greater |

~~~sql
CREATE TABLE team_results (
  result_id INT AUTO_INCREMENT PRIMARY KEY,
  match_id VARCHAR(20) NOT NULL UNIQUE,
  team_name VARCHAR(100) NOT NULL,
  wins INT NOT NULL,
  losses INT NOT NULL
);
~~~

A surrogate primary key supports database operations; the unique source identifier prevents accidental duplicates.

## Design questions

- Does one CSV row represent one entity or a relationship?
- Which values repeat independently and belong in related tables?
- Which constraints protect data quality?
- Will repeated imports insert, reject or update existing records?

Document and justify the chosen policy.

## Check

- [ ] Types and lengths fit expected values.
- [ ] Required fields are constrained.
- [ ] Duplicate behaviour is defined.
- [ ] Relationships reflect the solution’s data needs.

# Creating an Admin-Only CSV Upload Form

A CSV upload changes stored data and should be restricted to administrators. Apply session and role checks before any output.

~~~php
<?php
session_start();
if (!isset($_SESSION["user_id"])) {
    header("Location: login.php");
    exit;
}
if (($_SESSION["role"] ?? "") !== "admin") {
    http_response_code(403);
    exit("Permission denied.");
}
?>
<form method="post" enctype="multipart/form-data">
  <label for="dataset">CSV dataset</label>
  <input id="dataset" name="dataset" type="file" accept=".csv,text/csv" required>
  <button type="submit">Validate and import</button>
</form>
~~~

The `multipart/form-data` encoding is required. The accept attribute guides file selection but does not provide server-side security.

## Check

- [ ] Logged-out and standard users are rejected.
- [ ] The form has a visible label.
- [ ] File input has a restrictive accept hint.
- [ ] Processing repeats the server-side role check.

# Validating an Uploaded CSV File

Validate the upload before reading its rows.

~~~php
$file = $_FILES["dataset"] ?? null;
$errors = [];

if (!$file || $file["error"] !== UPLOAD_ERR_OK) {
    $errors[] = "Choose a CSV file that uploaded successfully.";
}
if ($file && $file["size"] > 2 * 1024 * 1024) {
    $errors[] = "The file must be 2 MB or smaller.";
}
$extension = $file ? strtolower(pathinfo($file["name"], PATHINFO_EXTENSION)) : "";
if ($extension !== "csv") {
    $errors[] = "The file must use the .csv extension.";
}
~~~

A filename or MIME type alone can be misleading. Combine upload status, size, extension, readable content, header and row validation.

Never use the original filename as a server path. Process the temporary upload and store only what the application requires.

## Check

Test missing files, oversized files, wrong extensions, empty files and malformed content. Every failure should produce a clear message and must not partially import data.

# Reading CSV Rows with fgetcsv

Use PHP’s CSV parser so quoted commas and escaped values are handled correctly.

~~~php
$handle = fopen($file["tmp_name"], "r");
if ($handle === false) {
    exit("The uploaded file could not be read.");
}

$headers = fgetcsv($handle);
$expected = ["match_id", "team_name", "wins", "losses"];

if ($headers !== $expected) {
    fclose($handle);
    exit("The CSV headings do not match the expected format.");
}

$rowNumber = 1;
while (($row = fgetcsv($handle)) !== false) {
    $rowNumber++;
    // Validate and store this row.
}
fclose($handle);
~~~

This loop demonstrates iteration. The header comparison prevents values being assigned to the wrong fields.

## Check

- [ ] File open failure is handled.
- [ ] The header is read separately.
- [ ] Exact expected headings are checked.
- [ ] Row numbers are tracked for useful feedback.
- [ ] The handle is closed.

# Validating CSV Rows

Validate every row before storing it.

~~~php
if (count($row) !== 4) {
    $rowErrors[] = "Row $rowNumber has the wrong number of fields.";
    continue;
}

[$matchId, $teamName, $winsRaw, $lossesRaw] = array_map("trim", $row);

$wins = filter_var($winsRaw, FILTER_VALIDATE_INT);
$losses = filter_var($lossesRaw, FILTER_VALIDATE_INT);

if ($matchId === "" || $teamName === "") {
    $rowErrors[] = "Row $rowNumber has a missing required value.";
    continue;
}
if ($wins === false || $losses === false || $wins < 0 || $losses < 0) {
    $rowErrors[] = "Row $rowNumber has invalid results.";
    continue;
}
~~~

The loop is iteration; each validation decision is selection. Preserve row numbers so an administrator can correct the source.

Define whether one bad row rejects the whole file or only that row. For assessed work, justify the policy from integrity and user needs.

## Check

Test blank, extra, missing, non-numeric, negative and duplicate values.

# Inserting Imported Rows Safely

Prepare the insert once, then execute it for each valid row.

~~~php
$insert = $pdo->prepare(
    "INSERT INTO team_results (match_id, team_name, wins, losses)
     VALUES (:match_id, :team_name, :wins, :losses)"
);

$insert->execute([
    "match_id" => $matchId,
    "team_name" => $teamName,
    "wins" => $wins,
    "losses" => $losses
]);
~~~

Use a transaction when the intended policy is all-or-nothing:

~~~php
$pdo->beginTransaction();
try {
    // Read, validate and insert every row.
    $pdo->commit();
} catch (Throwable $error) {
    $pdo->rollBack();
    throw $error;
}
~~~

Transactions prevent a failed whole-file import from leaving a partial update. If valid rows may be retained while invalid rows are rejected, count both outcomes and report them clearly.

## Check

- [ ] Prepared statements separate values from SQL.
- [ ] Duplicate behaviour is handled.
- [ ] Transaction policy matches the intended outcome.
- [ ] Raw database errors are not shown publicly.

# Reporting CSV Import Results

An administrator needs evidence of what happened, not just “upload complete”.

## Report useful totals

Show the escaped filename, rows read, inserted, updated, skipped and rejected, plus row-specific validation messages and whether a transaction committed or rolled back.

~~~php
$summary = [
  "read" => $rowsRead,
  "inserted" => $rowsInserted,
  "rejected" => count($rowErrors)
];
~~~

Totals must reconcile: rows read equals all outcome categories combined. Never display passwords, server paths or raw SQL errors.

## Accessible output

Use a clear heading and a list or table. Do not communicate success through colour alone. Make corrective messages specific: include the CSV row number and violated rule.

## Check

- [ ] Totals match database records.
- [ ] Both success and failure cases are tested.
- [ ] Messages help the administrator correct the file.
- [ ] Sensitive technical details remain hidden.

# Building a Complete Admin CSV Import

A complete import combines access control, upload checks, parsing, row validation, prepared statements and a result summary.

## Processing sequence

1. Start the session and require the administrator role.
2. Accept a POST upload.
3. Validate upload status, size and extension.
4. Open the temporary file and verify headers.
5. Begin the chosen transaction policy.
6. Iterate through rows.
7. Validate fields and store valid data.
8. Commit or roll back.
9. Close the file and display a summary.

## Pseudocode

~~~text
BEGIN
  REQUIRE administrator
  INPUT CSV
  IF file is invalid THEN OUTPUT error; STOP
  READ and CHECK header
  FOR EACH row
    VALIDATE fields
    IF valid THEN STORE with prepared statement
    ELSE RECORD row error
    ENDIF
  ENDFOR
  OUTPUT summary
END
~~~

This provides evidence of input, selection, iteration, storage and output. Separate repeated checks into functions when it improves readability.

## Check

Trace one valid and one invalid row through every step. Explain the duplicate and partial-import policy rather than leaving either to chance.

# Testing an Admin CSV Import

Testing must cover permissions, validation, database effects and feedback.

| Test | Condition | Expected result |
| --- | --- | --- |
| Logged out | Direct import URL | Redirect to login |
| Standard role | Direct URL or POST | 403; nothing imported |
| Valid CSV | Correct headings and rows | Expected records stored |
| Wrong heading | Changed column | File rejected |
| Invalid number | Text or negative result | Stated rejection policy |
| Duplicate ID | Existing identifier | Stated duplicate policy |
| Empty file | No usable rows | Clear rejection |
| Oversized file | Above limit | Rejected before parsing |

Record actual result, pass/fail and refinement. Verify the database rather than trusting the on-screen message.

Use fictional accounts and data. Hide credentials and unrelated information in screenshots.

## Completion checklist

- [ ] Direct access and processing are protected.
- [ ] Invalid data cannot silently enter storage.
- [ ] Counts reconcile with database rows.
- [ ] Error messages support correction.
- [ ] Retesting confirms refinements.

# Processing and Presenting Imported Data

Query, process and present stored data as meaningful outputs that respond to user needs and success criteria.

# Querying Data for a User Need

A query is meaningful when it answers a user question. Begin with the need, then choose fields, filters, calculations and order.

## Example need

A participant wants to find the strongest fictional teams and inspect their performance.

~~~sql
SELECT team_name,
       SUM(wins) AS total_wins,
       SUM(losses) AS total_losses
FROM team_results
GROUP BY team_name
ORDER BY total_wins DESC, team_name ASC;
~~~

This processes many stored rows into one summary per team. It is stronger evidence of processing than simply displaying the imported table.

## Plan the output

Document:

- user and question
- required source fields
- processing or calculation
- useful order/filter
- output form
- success criterion supported

## Check

- [ ] The query answers a stated need.
- [ ] Only required fields are used.
- [ ] Grouping and calculations are correct.
- [ ] Empty results are handled.
- [ ] Output can be tested against known fictional data.

# Building a Leaderboard

A leaderboard converts stored results into a ranked, understandable output.

~~~sql
SELECT team_name,
       SUM(wins) AS wins,
       SUM(losses) AS losses,
       SUM(wins) * 3 AS points
FROM team_results
GROUP BY team_name
ORDER BY points DESC, wins DESC, team_name ASC;
~~~

The points rule is an example only. Use the rule justified by the chosen context.

## Display the ranking

Iterate through the query result and create a table with rank, team, wins, losses and points. Increment rank inside the loop. Escape text and cast numbers.

Explain tie behaviour. A deterministic secondary sort prevents ranks from changing unpredictably.

## Test

Use a small dataset where you can calculate the result manually. Include a tie, zero values and an empty dataset.

## Check

- [ ] Ranking rule is stated.
- [ ] SQL aggregation matches the rule.
- [ ] Ties are handled predictably.
- [ ] Headers and a visible caption explain the table.
- [ ] Manual expected results match actual output.

# Calculating Summary Statistics

Statistics reduce a dataset to information users can interpret.

~~~sql
SELECT
  COUNT(*) AS result_count,
  COUNT(DISTINCT team_name) AS team_count,
  SUM(wins) AS total_wins,
  AVG(wins) AS average_wins,
  MAX(wins) AS highest_wins
FROM team_results;
~~~

Choose statistics because they answer a need, not because functions are available. Label values clearly and round averages deliberately.

~~~php
<p>Average wins:
  <?= number_format((float) $stats["average_wins"], 1) ?>
</p>
~~~

## Interpretation

A number without context is weak. State what population and timeframe it represents. Do not imply cause from a descriptive statistic.

## Check

- [ ] Each statistic has a purpose.
- [ ] Null or empty data is handled.
- [ ] Units and labels are visible.
- [ ] Rounding is consistent.
- [ ] Results are checked manually with a known dataset.

# Creating Match and Player Views

A detail view lets a user move from a summary to the record needed for a task.

## Receive a validated identifier

~~~php
$matchId = trim($_GET["match_id"] ?? "");
if ($matchId === "" || mb_strlen($matchId) > 20) {
    exit("Invalid match.");
}

$stmt = $pdo->prepare(
  "SELECT match_id, team_name, wins, losses
   FROM team_results
   WHERE match_id = :match_id"
);
$stmt->execute(["match_id" => $matchId]);
$match = $stmt->fetch();

if (!$match) {
    http_response_code(404);
    exit("Match not found.");
}
~~~

Display escaped values with headings that explain the record. Provide a logical way back to the summary.

For player views, use an appropriate relationship and do not invent personal data. All names and records must be fictional.

## Check

- [ ] Identifier is validated.
- [ ] Query is prepared.
- [ ] Missing record has a 404 response.
- [ ] Output supports the user’s journey.
- [ ] Text is escaped and data is fictional.

# Creating Charts from Processed SQL Data

A chart is useful only when it makes a comparison or pattern easier to understand. JavaScript is a supporting technology; the assessed reasoning lies in the data choice, processing and justified output.

## Prepare data in PHP

~~~php
$labels = array_column($rows, "team_name");
$values = array_map("intval", array_column($rows, "points"));
~~~

Pass encoded data safely:

~~~html
<script>
const labels = <?= json_encode($labels) ?>;
const values = <?= json_encode($values) ?>;
</script>
~~~

A chart library can use these arrays. Provide a visible title, axis labels, sufficient contrast and a text/table alternative.

## Choose the chart

- bar chart: compare teams or categories
- line chart: change over ordered time
- avoid pie charts when many categories or close values impede comparison

Do not create a chart from raw unprocessed data when a grouped or calculated result is what users need.

## Check

- [ ] Chart answers a stated question.
- [ ] SQL/PHP processing is explainable.
- [ ] Labels and units are present.
- [ ] Equivalent values are available without relying only on colour or graphics.
- [ ] Empty and extreme datasets are tested.

# Exporting Processed Data to CSV

CSV export can support download and reuse of a filtered or processed result. It is optional when import already satisfies the data-transfer requirement, but can be valuable for a justified user need.

## Send download headers

~~~php
header("Content-Type: text/csv; charset=UTF-8");
header('Content-Disposition: attachment; filename="team-summary.csv"');

$output = fopen("php://output", "w");
fputcsv($output, ["Team", "Wins", "Losses", "Points"]);

foreach ($rows as $row) {
    fputcsv($output, [
        $row["team_name"],
        $row["wins"],
        $row["losses"],
        $row["points"]
    ]);
}
fclose($output);
exit;
~~~

Run authentication and authorisation before output headers. Build `$rows` with the same validated filters used by the visible report.

## Test

Open the download in a text editor and spreadsheet. Check headings, quoted commas, character encoding, row count and filtered scope.

## Check

- [ ] Export serves a real user need.
- [ ] Access rules match the data.
- [ ] `fputcsv()` handles escaping.
- [ ] Output contains no unintended personal or sensitive data.
- [ ] Download matches the on-screen processed result.