Working with Data
- Importing JSON into MySQL with PHP
- Creating a Security Events Table
- Importing JSON into MySQL with PHP
- Querying Imported Data with SQL
- Building a Security Dashboard Using PHP and MySQL
- Data Visualisation with Google Charts
- Creating Charts with Google Charts
- Pie Charts from SQL Data
- Bar Charts from SQL Data
- Line Charts from SQL Data
- Working with APIs
- Creating a Simple JSON API with PHP
- Reading API Data with JavaScript
- Creating a Database-Driven API with PHP and MySQL
- Creating API Endpoints for Specific Data
- Working with JSON Data in JavaScript
Importing JSON into MySQL with PHP
Creating a Security Events Table
In this tutorial, you will create a MySQL table to store security event data imported from a JSON file.
The JSON file contains homes, devices and events. Rather than storing the entire JSON structure, each event will be stored as a separate row in a database table.
This approach makes it easier to search, filter and analyse the data using SQL.
Open phpMyAdmin
Open phpMyAdmin in your browser.
Example:
http://localhost/phpmyadmin/
Select your existing database:
project_db
Create the Security Events Table
Select the SQL tab and run:
CREATE TABLE security_events (

    event_id INT AUTO_INCREMENT PRIMARY KEY,

    device_id VARCHAR(50) NOT NULL,

    device_type VARCHAR(100) NOT NULL,

    room VARCHAR(100) NOT NULL,

    event_timestamp DATETIME NOT NULL,

    event_type VARCHAR(100) NOT NULL,

    data_transmitted VARCHAR(100) NOT NULL,

    severity VARCHAR(20) NOT NULL,

    access_result VARCHAR(20) NOT NULL

);
This creates a table capable of storing all event information from the JSON file.
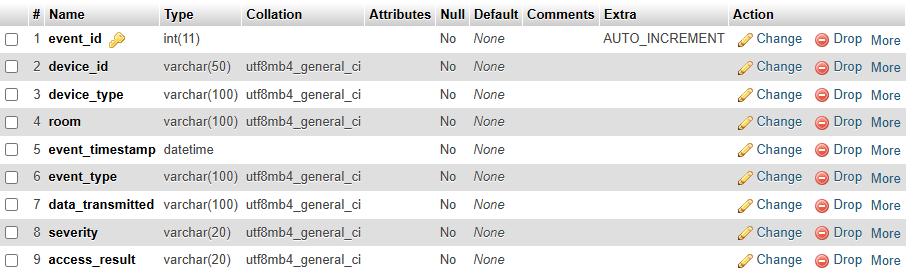
Review the Table Structure
The completed table should contain the following fields:
| Field | Purpose |
|---|---|
| event_id | Unique identifier for each event |
| device_id | Device that generated the event |
| device_type | Type of device |
| room | Location of the device |
| event_timestamp | Date and time of the event |
| event_type | Type of activity |
| data_transmitted | Data involved in the event |
| severity | Event severity level |
| access_result | Result of the event |
View the Table Structure
Run:
DESCRIBE security_events;
You should see a structure similar to:
| Field | Type |
|---|---|
| event_id | int |
| device_id | varchar(50) |
| device_type | varchar(100) |
| room | varchar(100) |
| event_timestamp | datetime |
| event_type | varchar(100) |
| data_transmitted | varchar(100) |
| severity | varchar(20) |
| access_result | varchar(20) |
Insert a Test Record
Before importing JSON data, insert a test record to verify the table works correctly.
Run:
INSERT INTO security_events (

    device_id,
    device_type,
    room,
    event_timestamp,
    event_type,
    data_transmitted,
    severity,
    access_result

)
VALUES (

    'CAM-01',
    'Security Camera',
    'Front Entrance',
    '2026-03-14 02:18:45',
    'motion_detected',
    'video_stream',
    'high',
    'authorised'

);
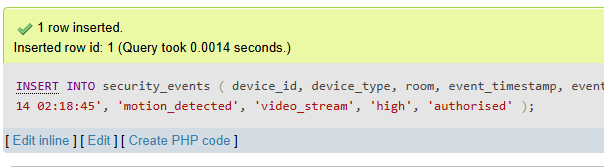
If successful, MySQL will report:
1 row inserted
View the Data
Run:
SELECT * FROM security_events;
You should see:
| event_id | device_id | device_type | room | event_timestamp | event_type | severity |
|---|---|---|---|---|---|---|
| 1 | CAM-01 | Security Camera | Front Entrance | 2026-03-14 02:18:45 | motion_detected | high |
Delete the Test Record
The test record is no longer required.
Run:
DELETE FROM security_events;
Verify the table is empty:
SELECT * FROM security_events;
You should see:
Empty set
Complete SQL Script
CREATE TABLE security_events (

    event_id INT AUTO_INCREMENT PRIMARY KEY,

    device_id VARCHAR(50) NOT NULL,

    device_type VARCHAR(100) NOT NULL,

    room VARCHAR(100) NOT NULL,

    event_timestamp DATETIME NOT NULL,

    event_type VARCHAR(100) NOT NULL,

    data_transmitted VARCHAR(100) NOT NULL,

    severity VARCHAR(20) NOT NULL,

    access_result VARCHAR(20) NOT NULL

);

INSERT INTO security_events (

    device_id,
    device_type,
    room,
    event_timestamp,
    event_type,
    data_transmitted,
    severity,
    access_result

)
VALUES (

    'CAM-01',
    'Security Camera',
    'Front Entrance',
    '2026-03-14 02:18:45',
    'motion_detected',
    'video_stream',
    'high',
    'authorised'

);

SELECT * FROM security_events;

DELETE FROM security_events;
You now have a database table ready to receive event data from a JSON file.
Next tutorial: Importing JSON into MySQL with PHP.
Importing JSON into MySQL with PHP
In the previous tutorial, you created a security_events table. In this tutorial, you will read data from a JSON file and import it into MySQL using PHP.
The JSON file contains devices and events. Each event will be inserted into the security_events table as a separate database record.
Project Structure
Your project should contain:
json-import
├── import_json.php
└── smart_security_data.json
Copy the JSON file into your project folder.
Create the Import Script
Create a new file called:
import_json.php
Add the following code:
<?php

$conn = new mysqli(
    "localhost",
    "root",
    "",
    "project_db"
);

if ($conn->connect_error) {
    die("Connection failed: " . $conn->connect_error);
}

echo "Database connection successful.";

?>
Test the Database Connection
Open:
http://localhost/json-import/import_json.php
You should see:
Database connection successful.
Read the JSON File
Add the following code underneath the database connection:
$json = file_get_contents(
    "smart_security_data.json"
);

echo $json;
Refresh the page.
The contents of the JSON file should be displayed in the browser.

Convert the JSON into a PHP Array
Replace:
echo $json;
with:
$data = json_decode(
    $json,
    true
);

print_r($data);
Refresh the page.
You should now see a PHP array structure.

Loop Through the Devices
Replace:
print_r($data);
with:
foreach ($data["devices"] as $device) {

    echo "<h3>";
    echo $device["deviceId"];
    echo "</h3>";

}
Refresh the page.
You should see:
CAM-01

LOCK-02
Loop Through the Events
Replace the previous code with:
foreach ($data["devices"] as $device) {

    foreach ($device["events"] as $event) {

        echo $event["eventType"];
        echo "<br>";

    }

}
Refresh the page.
You should see:
motion_detected
remote_access_attempt
unlock_attempt
Prepare the INSERT Statement
Add the following code before the loops:
$stmt = $conn->prepare(
    "INSERT INTO security_events (

        device_id,
        device_type,
        room,
        event_timestamp,
        event_type,
        data_transmitted,
        severity,
        access_result

    )
    VALUES (?, ?, ?, ?, ?, ?, ?, ?)"
);
This statement will be reused for every event.
Insert the Events
Replace the existing loops with:
foreach ($data["devices"] as $device) {

    foreach ($device["events"] as $event) {

        $stmt->bind_param(
            "ssssssss",

            $device["deviceId"],
            $device["deviceType"],
            $device["room"],

            $event["timestamp"],
            $event["eventType"],
            $event["dataTransmitted"],
            $event["severity"],
            $event["accessResult"]

        );

        $stmt->execute();

    }

}
Display a Success Message
Add:
echo "Import completed successfully.";
after the loops.
The completed import should now run automatically when the page loads.
Run the Import
Open:
http://localhost/json-import/import_json.php
You should see:
Import completed successfully.
Verify the Imported Data
Open phpMyAdmin.
Run:
SELECT * FROM security_events;
You should now see three imported events from the JSON file.
Example:
| event_id | device_id | event_type | severity |
|---|---|---|---|
| 1 | CAM-01 | motion_detected | high |
| 2 | CAM-01 | remote_access_attempt | critical |
| 3 | LOCK-02 | unlock_attempt | medium |
Complete import_json.php File
<?php

$conn = new mysqli(
    "localhost",
    "root",
    "",
    "project_db"
);

if ($conn->connect_error) {
    die("Connection failed: " . $conn->connect_error);
}

$json = file_get_contents(
    "smart_security_data.json"
);

$data = json_decode(
    $json,
    true
);

$stmt = $conn->prepare(
    "INSERT INTO security_events (

        device_id,
        device_type,
        room,
        event_timestamp,
        event_type,
        data_transmitted,
        severity,
        access_result

    )
    VALUES (?, ?, ?, ?, ?, ?, ?, ?)"
);

foreach ($data["devices"] as $device) {

    foreach ($device["events"] as $event) {

        $stmt->bind_param(
            "ssssssss",

            $device["deviceId"],
            $device["deviceType"],
            $device["room"],

            $event["timestamp"],
            $event["eventType"],
            $event["dataTransmitted"],
            $event["severity"],
            $event["accessResult"]

        );

        $stmt->execute();

    }

}

echo "Import completed successfully.";

?>
You have successfully imported JSON data into MySQL using PHP.
Next tutorial: Querying Imported Data with SQL.
Querying Imported Data with SQL
In the previous tutorial, you imported JSON data into the security_events table. In this tutorial, you will use SQL queries to analyse the imported data.
View All Events
Open phpMyAdmin and select the:
security_events
table.
Run:
SELECT *
FROM security_events;
This displays all imported records.
Count All Events
To find the total number of events:
SELECT COUNT(*) AS total_events
FROM security_events;
Example result:
| total_events |
|---|
| 3 |
This query is useful for dashboards and reporting.
Find Critical Events
To display only critical events:
SELECT *
FROM security_events
WHERE severity = 'critical';
Example result:
| device_id | event_type | severity |
|---|---|---|
| CAM-01 | remote_access_attempt | critical |
Count Events by Severity
Run:
SELECT
    severity,
    COUNT(*) AS total
FROM security_events
GROUP BY severity;
Example result:
| severity | total |
|---|---|
| critical | 1 |
| high | 1 |
| medium | 1 |
This is often used to build dashboard summary cards.
Find Events from a Specific Device
To display events generated by the security camera:
SELECT *
FROM security_events
WHERE device_id = 'CAM-01';
Example result:
| device_id | event_type |
|---|---|
| CAM-01 | motion_detected |
| CAM-01 | remote_access_attempt |
Count Events Per Device
Run:
SELECT
    device_id,
    COUNT(*) AS total_events
FROM security_events
GROUP BY device_id;
Example result:
| device_id | total_events |
|---|---|
| CAM-01 | 2 |
| LOCK-02 | 1 |
This identifies which devices are generating the most activity.
Find High-Risk Events
To display high and critical events:
SELECT *
FROM security_events
WHERE severity IN ('high', 'critical');
Example result:
| device_id | event_type | severity |
|---|---|---|
| CAM-01 | motion_detected | high |
| CAM-01 | remote_access_attempt | critical |
This query could be used to generate security alerts.
Sort Events by Time
To view the newest events first:
SELECT *
FROM security_events
ORDER BY event_timestamp DESC;
This is commonly used in event logs and monitoring systems.
Useful Dashboard Queries
Total Events
SELECT COUNT(*) AS total_events
FROM security_events;
Critical Events
SELECT COUNT(*) AS critical_events
FROM security_events
WHERE severity = 'critical';
Device Count
SELECT COUNT(DISTINCT device_id) AS total_devices
FROM security_events;
Events by Severity
SELECT
    severity,
    COUNT(*) AS total
FROM security_events
GROUP BY severity;
These queries are commonly used when building dashboards.
Complete Practice Queries
SELECT *
FROM security_events;

SELECT COUNT(*) AS total_events
FROM security_events;

SELECT *
FROM security_events
WHERE severity = 'critical';

SELECT
    severity,
    COUNT(*) AS total
FROM security_events
GROUP BY severity;

SELECT
    device_id,
    COUNT(*) AS total_events
FROM security_events
GROUP BY device_id;

SELECT *
FROM security_events
ORDER BY event_timestamp DESC;
You have successfully queried imported JSON data using SQL.
Next tutorial: Building a Security Dashboard Using PHP and MySQL.
Building a Security Dashboard Using PHP and MySQL
In the previous tutorial, you used SQL queries to analyse imported JSON data. In this tutorial, you will build a dashboard that displays security statistics directly from the database.
The dashboard will display:
- Total Devices
- Total Events
- Critical Events
- High Events
- Recent Security Events
Create the Dashboard File
Create a new file called:
dashboard.php
Add the database connection:
<?php

$conn = new mysqli(
    "localhost",
    "root",
    "",
    "project_db"
);

if ($conn->connect_error) {
    die("Connection failed: " . $conn->connect_error);
}

?>
Get the Total Number of Events
Add:
$totalEventsQuery = "
    SELECT COUNT(*) AS total_events
    FROM security_events
";

$totalEventsResult =
    $conn->query($totalEventsQuery);

$totalEvents =
    $totalEventsResult->fetch_assoc()["total_events"];
Get the Number of Devices
Add:
$totalDevicesQuery = "
    SELECT COUNT(DISTINCT device_id)
    AS total_devices
    FROM security_events
";

$totalDevicesResult =
    $conn->query($totalDevicesQuery);

$totalDevices =
    $totalDevicesResult->fetch_assoc()["total_devices"];
Get Critical Events
Add:
$criticalEventsQuery = "
    SELECT COUNT(*) AS critical_events
    FROM security_events
    WHERE severity = 'critical'
";

$criticalEventsResult =
    $conn->query($criticalEventsQuery);

$criticalEvents =
    $criticalEventsResult->fetch_assoc()["critical_events"];
Get High Events
Add:
$highEventsQuery = "
    SELECT COUNT(*) AS high_events
    FROM security_events
    WHERE severity = 'high'
";

$highEventsResult =
    $conn->query($highEventsQuery);

$highEvents =
    $highEventsResult->fetch_assoc()["high_events"];
Create the Dashboard Page
Add the following HTML underneath the PHP code:
<!DOCTYPE html>
<html>
<head>
    <title>Security Dashboard</title>
</head>
<body>

<h1>Security Dashboard</h1>

<div>
    <h2>Total Devices</h2>
    <p><?php echo $totalDevices; ?></p>
</div>

<div>
    <h2>Total Events</h2>
    <p><?php echo $totalEvents; ?></p>
</div>

<div>
    <h2>Critical Events</h2>
    <p><?php echo $criticalEvents; ?></p>
</div>

<div>
    <h2>High Events</h2>
    <p><?php echo $highEvents; ?></p>
</div>

</body>
</html>
Test the Dashboard
Open:
http://localhost/json-import/dashboard.php
Using the sample data, you should see something similar to:
Security Dashboard

Total Devices: 2
Total Events: 3
Critical Events: 1
High Events: 1
Display Recent Events
Add the following query before the HTML:
$recentEventsQuery = "
    SELECT *
    FROM security_events
    ORDER BY event_timestamp DESC
";

$recentEvents =
    $conn->query($recentEventsQuery);
Create the Events Table
Add the following underneath the dashboard cards:
<h2>Recent Events</h2>

<table border="1">

<tr>
    <th>Device</th>
    <th>Event Type</th>
    <th>Severity</th>
    <th>Timestamp</th>
</tr>

<?php

while (
    $row =
    $recentEvents->fetch_assoc()
) {

?>

<tr>
    <td><?php echo $row["device_id"]; ?></td>
    <td><?php echo $row["event_type"]; ?></td>
    <td><?php echo $row["severity"]; ?></td>
    <td><?php echo $row["event_timestamp"]; ?></td>
</tr>

<?php

}

?>

</table>
Refresh the page.
You should now see all imported events underneath the dashboard.
Add Basic Styling
Inside the <head> section add:
<style>

body {
    font-family: Arial, sans-serif;
}

.card {
    border: 1px solid #cccccc;
    border-radius: 8px;
    padding: 15px;
    margin-bottom: 10px;
}

table {
    border-collapse: collapse;
    width: 100%;
}

th,
td {
    border: 1px solid #cccccc;
    padding: 10px;
}

th {
    background-color: #f2f2f2;
}

</style>
Then update each dashboard <div>:
<div class="card">
The dashboard should now look much more professional.
Complete Dashboard Features
Your dashboard now:
- Connects to MySQL
- Runs SQL queries
- Displays summary statistics
- Displays recent events
- Updates automatically whenever new JSON data is imported
This is one of the major advantages of importing JSON into a database rather than displaying the JSON directly.
Next tutorial: Creating Filters and Search Options for the Dashboard.
Data Visualisation with Google Charts
Creating Charts with Google Charts
Google Charts is a free JavaScript library that can create professional graphs and charts using your data.
Google Charts can display:
- Pie Charts
- Bar Charts
- Column Charts
- Line Charts
- Area Charts
In this tutorial you will create your first chart using sample data.
Step 1 - Load the Google Charts Library
Add the following line inside the <head> section of your webpage.
<script src="https://www.gstatic.com/charts/loader.js"></script>
Step 2 - Create a Chart Container
Add a div where the chart will be displayed.
<div id="chart_div"
     style="width:800px; height:500px;">
</div>
Step 3 - Create the Chart
Add the following JavaScript before the closing </body> tag.
<script>

google.charts.load(
    'current',
    {'packages':['corechart']}
);

google.charts.setOnLoadCallback(drawChart);

function drawChart()
{

    var data =
        google.visualization.arrayToDataTable([

        ['Risk Level', 'Count'],

        ['Low',15],

        ['Medium',8],

        ['High',3]

    ]);


    var options = {

        title:'Security Events by Risk Level'

    };


    var chart =
        new google.visualization.PieChart(

        document.getElementById('chart_div')

    );


    chart.draw(data, options);

}

</script>
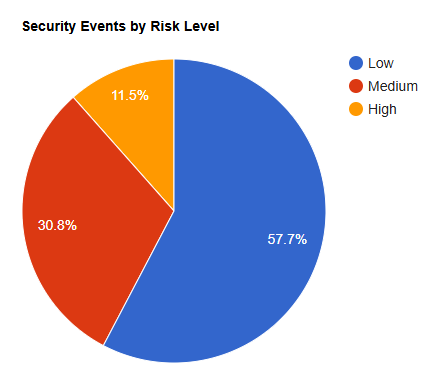
Understanding the Data
Google Charts uses an array to store chart data.
[
 ['Risk Level', 'Count'],

 ['Low',15],

 ['Medium',8],

 ['High',3]
]
The first row contains the headings.
The remaining rows contain the data values.
Changing the Chart Type
The chart type is controlled by:
google.visualization.PieChart
You can change it to:
| Chart | Class |
|---|---|
| Pie Chart | PieChart |
| Column Chart | ColumnChart |
| Bar Chart | BarChart |
| Line Chart | LineChart |
| Area Chart | AreaChart |
Example:
google.visualization.BarChart
will display the same data as a bar chart.
Complete Example
<!DOCTYPE html>

<html>

<head>

    <title>Google Charts Example</title>

    <script src="https://www.gstatic.com/charts/loader.js"></script>

</head>

<body>

<div id="chart_div"
     style="width:800px; height:500px;">
</div>


<script>

google.charts.load(
    'current',
    {'packages':['corechart']}
);

google.charts.setOnLoadCallback(drawChart);

function drawChart()
{

    var data =
        google.visualization.arrayToDataTable([

        ['Risk Level', 'Count'],

        ['Low',15],

        ['Medium',8],

        ['High',3]

    ]);


    var options = {

        title:'Security Events by Risk Level'

    };


    var chart =
        new google.visualization.PieChart(

        document.getElementById('chart_div')

    );


    chart.draw(data, options);

}

</script>

</body>

</html>
Next Tutorial
Pie Charts from SQL Data
Instead of manually entering the data, you will learn how to retrieve information from a MySQL database and display it automatically in a Google Chart.
Pie Charts from SQL Data
In the previous tutorial, the chart data was entered manually.
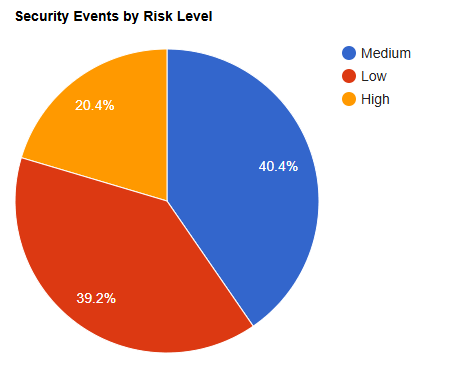
In this tutorial, the chart data will come directly from a MySQL database.
The example below uses the cyber_security_events table.
Step 1 - Create the SQL Query
The following query counts how many events belong to each risk level.
SELECT

    risk_level,

    COUNT(*) AS total

FROM cyber_security_events

GROUP BY risk_level;
Example result:
| risk_level | total |
|---|---|
| Low | 15 |
| Medium | 8 |
| High | 3 |
Step 2 - Retrieve the Data with PHP
<?php

$sql = "

SELECT

    risk_level,

    COUNT(*) AS total

FROM cyber_security_events

GROUP BY risk_level

";

$result = $pdo->query($sql);

$data = [];

while($row = $result->fetch())
{

    $data[] = [

        $row['risk_level'],

        (int)$row['total']

    ];

}

?>
Step 3 - Convert the PHP Array to JSON
Google Charts uses JavaScript arrays.
PHP can convert data into JavaScript using:
<?php

echo json_encode($data);

?>
Step 4 - Create the Chart
<script>

google.charts.load(
    'current',
    {'packages':['corechart']}
);

google.charts.setOnLoadCallback(drawChart);

function drawChart()
{

    var data = google.visualization.arrayToDataTable([

        ['Risk Level','Count'],

        ...<?php echo json_encode($data); ?>

    ]);


    var options = {

        title:
        'Security Events by Risk Level'

    };


    var chart =

        new google.visualization.PieChart(

            document.getElementById('chart_div')

        );


    chart.draw(data, options);

}

</script>
Step 5 - Add the Chart Container
<div id="chart_div"
     style="width:800px; height:500px;">
</div>
Complete Example
<?php

$sql = "

SELECT

    risk_level,

    COUNT(*) AS total

FROM cyber_security_events

GROUP BY risk_level

";

$result = $pdo->query($sql);

$data = [];

while($row = $result->fetch())
{

    $data[] = [

        $row['risk_level'],

        (int)$row['total']

    ];

}

?>

<!DOCTYPE html>

<html>

<head>

<script src="https://www.gstatic.com/charts/loader.js"></script>

</head>

<body>

<div id="chart_div"
     style="width:800px; height:500px;">
</div>


<script>

google.charts.load(
    'current',
    {'packages':['corechart']}
);

google.charts.setOnLoadCallback(drawChart);

function drawChart()
{

    var data =

        google.visualization.arrayToDataTable([

        ['Risk Level','Count'],

        ...<?php echo json_encode($data); ?>

    ]);


    var options = {

        title:
        'Security Events by Risk Level'

    };


    var chart =

        new google.visualization.PieChart(

            document.getElementById('chart_div')

        );


    chart.draw(data, options);

}

</script>

</body>

</html>
Next Tutorial
Bar Charts from SQL Data
Learn how to display the same SQL data as a bar chart.
Bar Charts from SQL Data
Bar charts are useful for comparing values between categories.
In this tutorial, the number of security events at each risk level will be displayed as a bar chart.
Step 1 - Create the SQL Query
SELECT

    risk_level,

    COUNT(*) AS total

FROM cyber_security_events

GROUP BY risk_level;
Example result:
| risk_level | total |
|---|---|
| Low | 15 |
| Medium | 8 |
| High | 3 |
Step 2 - Retrieve the Data with PHP
<?php

$sql = "

SELECT

    risk_level,

    COUNT(*) AS total

FROM cyber_security_events

GROUP BY risk_level

";

$result = $pdo->query($sql);

$data = [];

while($row = $result->fetch())
{

    $data[] = [

        $row['risk_level'],

        (int)$row['total']

    ];

}

?>
Step 3 - Create the Chart Container
<div id="chart_div"
     style="width:900px; height:500px;">
</div>
Step 4 - Create the Bar Chart
<script>

google.charts.load(
    'current',
    {'packages':['corechart']}
);

google.charts.setOnLoadCallback(drawChart);

function drawChart()
{

    var data =

        google.visualization.arrayToDataTable([

        ['Risk Level','Events'],

        ...<?php echo json_encode($data); ?>

    ]);


    var options = {

        title:'Security Events by Risk Level',

        legend:{position:'none'}

    };


    var chart =

        new google.visualization.BarChart(

            document.getElementById('chart_div')

        );


    chart.draw(data, options);

}

</script>
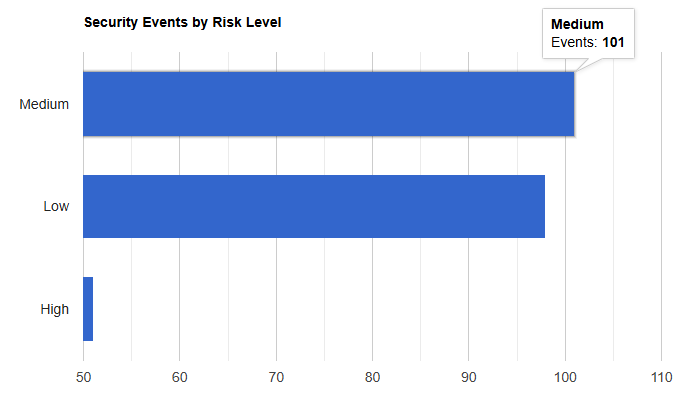
Changing the Chart Type
Only one line of code needs to change.
Pie Chart:
new google.visualization.PieChart()
Bar Chart:
new google.visualization.BarChart()
Column Chart:
new google.visualization.ColumnChart()
Line Chart:
new google.visualization.LineChart()
Complete Example
<?php

$sql = "

SELECT

    risk_level,

    COUNT(*) AS total

FROM cyber_security_events

GROUP BY risk_level

";

$result = $pdo->query($sql);

$data = [];

while($row = $result->fetch())
{

    $data[] = [

        $row['risk_level'],

        (int)$row['total']

    ];

}

?>

<!DOCTYPE html>

<html>

<head>

<script src="https://www.gstatic.com/charts/loader.js"></script>

</head>

<body>

<div id="chart_div"
     style="width:900px; height:500px;">
</div>


<script>

google.charts.load(
    'current',
    {'packages':['corechart']}
);

google.charts.setOnLoadCallback(drawChart);

function drawChart()
{

    var data =

        google.visualization.arrayToDataTable([

        ['Risk Level','Events'],

        ...<?php echo json_encode($data); ?>

    ]);


    var options = {

        title:'Security Events by Risk Level',

        legend:{position:'none'}

    };


    var chart =

        new google.visualization.BarChart(

            document.getElementById('chart_div')

        );


    chart.draw(data, options);

}

</script>

</body>

</html>
Next Tutorial
Line Charts from SQL Data
Learn how to display trends and changes over time using a line chart.
Line Charts from SQL Data
Line charts are used to display trends and changes over time.
In this tutorial, the number of security events per day will be displayed using a line chart.
Step 1 - Create the SQL Query
The following query counts the number of events recorded each day.
SELECT

    DATE(event_timestamp) AS event_date,

    COUNT(*) AS total

FROM cyber_security_events

GROUP BY DATE(event_timestamp)

ORDER BY event_date;
Example result:
| event_date | total |
|---|---|
| 2026-06-01 | 12 |
| 2026-06-02 | 18 |
| 2026-06-03 | 9 |
| 2026-06-04 | 15 |
Step 2 - Retrieve the Data with PHP
<?php

$sql = "

SELECT

    DATE(event_timestamp) AS event_date,

    COUNT(*) AS total

FROM cyber_security_events

GROUP BY DATE(event_timestamp)

ORDER BY event_date

";

$result = $pdo->query($sql);

$data = [];

while($row = $result->fetch())
{

    $data[] = [

        $row['event_date'],

        (int)$row['total']

    ];

}

?>
Step 3 - Create the Chart Container
<div id="chart_div"
     style="width:900px; height:500px;">
</div>
Step 4 - Create the Line Chart
<script>

google.charts.load(
    'current',
    {'packages':['corechart']}
);

google.charts.setOnLoadCallback(drawChart);

function drawChart()
{

    var data =

        google.visualization.arrayToDataTable([

        ['Date','Events'],

        ...<?php echo json_encode($data); ?>

    ]);


    var options = {

        title:'Security Events Over Time',

        curveType:'function',

        legend:{position:'bottom'}

    };


    var chart =

        new google.visualization.LineChart(

            document.getElementById('chart_div')

        );


    chart.draw(data, options);

}

</script>
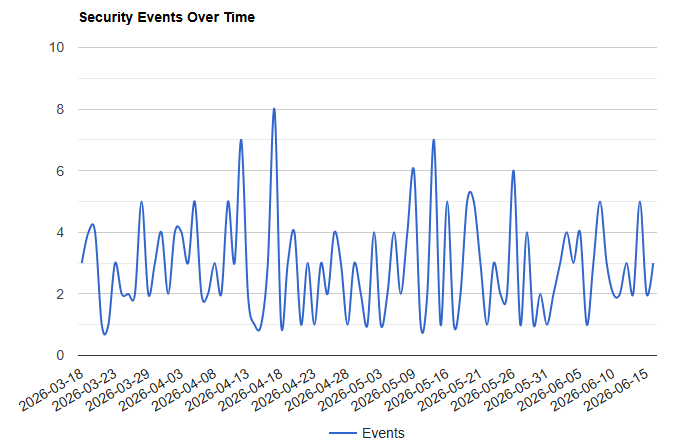
Understanding the Chart
The horizontal axis displays:
Date
The vertical axis displays:
Number of Security Events
This makes it easier to identify:
- Busy periods
- Trends over time
- Sudden increases in activity
- Patterns in the data
Complete Example
<?php

$sql = "

SELECT

    DATE(event_timestamp) AS event_date,

    COUNT(*) AS total

FROM cyber_security_events

GROUP BY DATE(event_timestamp)

ORDER BY event_date

";

$result = $pdo->query($sql);

$data = [];

while($row = $result->fetch())
{

    $data[] = [

        $row['event_date'],

        (int)$row['total']

    ];

}

?>

<!DOCTYPE html>

<html>

<head>

<script src="https://www.gstatic.com/charts/loader.js"></script>

</head>

<body>

<div id="chart_div"
     style="width:900px; height:500px;">
</div>


<script>

google.charts.load(
    'current',
    {'packages':['corechart']}
);

google.charts.setOnLoadCallback(drawChart);

function drawChart()
{

    var data =

        google.visualization.arrayToDataTable([

        ['Date','Events'],

        ...<?php echo json_encode($data); ?>

    ]);


    var options = {

        title:'Security Events Over Time',

        curveType:'function',

        legend:{position:'bottom'}

    };


    var chart =

        new google.visualization.LineChart(

            document.getElementById('chart_div')

        );


    chart.draw(data, options);

}

</script>

</body>

</html>
Working with APIs
Creating a Simple JSON API with PHP
In this tutorial, you will create a simple API using PHP.
The API will return JSON data when visited in a browser.
This is the same type of data format used by many real-world APIs.
Project Structure
Create a folder called:
api-demo
Inside the folder place:
api-demo
├── api.php
└── smart_security_data.json
Create the API File
Create:
api.php
Add:
<?php

header(
    "Content-Type: application/json"
);

echo file_get_contents(
    "smart_security_data.json"
);

?>
Save the file.
Understanding the Code
This line tells the browser that JSON data is being returned:
header(
    "Content-Type: application/json"
);
This line reads the JSON file:
file_get_contents(
    "smart_security_data.json"
);
This line sends the JSON data to the browser:
echo file_get_contents(
    "smart_security_data.json"
);
Test the API
Open:
http://localhost/api-demo/api.php
You should see:
{
  "homeId": "GC-HOME-014",
  "location": "Gold Coast"
}
along with the rest of the JSON data.
Test the API in a New Browser Tab
Notice that the URL now behaves like a data source.
Instead of displaying a webpage, it returns structured JSON data.
This is the same concept used by many modern APIs.
Example:
https://example.com/api/users
https://example.com/api/products
https://example.com/api/weather
Complete API File
<?php

header(
    "Content-Type: application/json"
);

echo file_get_contents(
    "smart_security_data.json"
);

?>
You have successfully created a JSON API using PHP.
Next tutorial: Reading API Data with JavaScript.
Reading API Data with JavaScript
In the previous tutorial, you created a simple API using PHP.
The API returns JSON data when visited in a browser.
In this tutorial, you will use JavaScript to read data from the API and display it on a webpage.
Project Structure
Your project should contain:
api-demo
├── api.php
├── index.html
└── smart_security_data.json
Create the HTML Page
Create:
index.html
Add:
<!DOCTYPE html>
<html>
<head>
    <title>API Demo</title>
</head>
<body>

<h1>API Dashboard</h1>

<div id="output"></div>

<script>

</script>

</body>
</html>
Save the file.
Read the API
Inside the <script> tags add:
fetch("api.php")
    .then(response => response.json())
    .then(data => {

        console.log(data);

    });
Save the file.
Test the API Request
Open:
http://localhost/api-demo/
Press:
F12
Open the Console tab.
You should see the JSON object displayed.
Display the Home Information
Replace:
console.log(data);
with:
document.getElementById(
    "output"
).innerHTML = `

    <p>
        <strong>Home ID:</strong>
        ${data.homeId}
    </p>

    <p>
        <strong>Location:</strong>
        ${data.location}
    </p>

`;
Refresh the page.
You should see:
Home ID: GC-HOME-014

Location: Gold Coast
Display Device Information
Replace the existing code with:
let html = `

    <h2>Devices</h2>

    <table border="1">

        <tr>
            <th>Device ID</th>
            <th>Device Type</th>
            <th>Room</th>
        </tr>

`;

data.devices.forEach(device => {

    html += `

        <tr>
            <td>${device.deviceId}</td>
            <td>${device.deviceType}</td>
            <td>${device.room}</td>
        </tr>

    `;

});

html += "</table>";

document.getElementById(
    "output"
).innerHTML = html;
Refresh the page.
You should now see a table of devices.
Why Use an API?
Previously, the data was loaded directly from:
fetch("smart_security_data.json")
Now the data is loaded from:
fetch("api.php")
This means the data can be:
- Generated dynamically
- Stored in a database
- Updated automatically
- Filtered before being sent
The webpage does not need to know where the data comes from. It only needs the JSON returned by the API.
Complete Page
<!DOCTYPE html>
<html>
<head>
    <title>API Demo</title>
</head>
<body>

<h1>API Dashboard</h1>

<div id="output"></div>

<script>

fetch("api.php")
    .then(response => response.json())
    .then(data => {

        let html = `

            <h2>Devices</h2>

            <table border="1">

                <tr>
                    <th>Device ID</th>
                    <th>Device Type</th>
                    <th>Room</th>
                </tr>

        `;

        data.devices.forEach(device => {

            html += `

                <tr>
                    <td>${device.deviceId}</td>
                    <td>${device.deviceType}</td>
                    <td>${device.room}</td>
                </tr>

            `;

        });

        html += "</table>";

        document.getElementById(
            "output"
        ).innerHTML = html;

    });

</script>

</body>
</html>
You have successfully consumed data from an API using JavaScript.
Next tutorial: Creating a Database-Driven API with PHP and MySQL.
Creating a Database-Driven API with PHP and MySQL
In the previous tutorials, the API returned data from a JSON file.
In this tutorial, you will create an API that reads data from a MySQL database and returns it as JSON.
The System Architecture
The completed system will work like this:
security_events table
        ↓
      api.php
        ↓
       JSON
        ↓
   JavaScript
Instead of reading a JSON file, the API will generate JSON directly from the database.
Create the API File
Create:
api_events.php
Add the database connection:
<?php

$conn = new mysqli(
    "localhost",
    "root",
    "",
    "project_db"
);

if ($conn->connect_error) {
    die("Connection failed: " .
        $conn->connect_error);
}

?>
Set the Content Type
Add:
header(
    "Content-Type: application/json"
);
The API will now return JSON instead of HTML.
Query the Database
Add:
$query = "
    SELECT *
    FROM security_events
";

$result =
    $conn->query($query);
This retrieves all records from the table.
Create an Array
Add:
$events = [];
This array will hold all database records.
Loop Through the Results
Add:
while (
    $row =
    $result->fetch_assoc()
) {

    $events[] = $row;

}
This converts each database record into an array item.
Convert the Array to JSON
Add:
echo json_encode(
    $events,
    JSON_PRETTY_PRINT
);
The completed API should now return JSON.
Test the API
Open:
http://localhost/api-demo/api_events.php
You should see:
[
    {
        "event_id":"1",
        "device_id":"CAM-01",
        "event_type":"motion_detected",
        "severity":"high"
    },
    {
        "event_id":"2",
        "device_id":"CAM-01",
        "event_type":"remote_access_attempt",
        "severity":"critical"
    }
]
The exact records will depend on your database.
Complete API File
<?php

$conn = new mysqli(
    "localhost",
    "root",
    "",
    "project_db"
);

if ($conn->connect_error) {
    die("Connection failed: " .
        $conn->connect_error);
}

header(
    "Content-Type: application/json"
);

$query = "
    SELECT *
    FROM security_events
";

$result =
    $conn->query($query);

$events = [];

while (
    $row =
    $result->fetch_assoc()
) {

    $events[] = $row;

}

echo json_encode(
    $events,
    JSON_PRETTY_PRINT
);

?>
Create a Webpage to Read the API
Create:
events.html
Add:
<!DOCTYPE html>
<html>
<head>
    <title>Security Events</title>
</head>
<body>

<h1>Security Events</h1>

<div id="output"></div>

<script>

fetch("api_events.php")
    .then(response => response.json())
    .then(data => {

        let html = `
            <table border="1">

                <tr>
                    <th>Device</th>
                    <th>Event Type</th>
                    <th>Severity</th>
                </tr>
        `;

        data.forEach(event => {

            html += `
                <tr>
                    <td>${event.device_id}</td>
                    <td>${event.event_type}</td>
                    <td>${event.severity}</td>
                </tr>
            `;

        });

        html += "</table>";

        document.getElementById(
            "output"
        ).innerHTML = html;

    });

</script>

</body>
</html>
Test the Complete System
Open:
http://localhost/api-demo/events.html
The page should display the records stored in MySQL.
Why This Is Useful
Previously:
JSON File
↓
JavaScript
Now:
MySQL Database
↓
PHP API
↓
JavaScript
This means:
- New records can be added to the database
- The API updates automatically
- The webpage updates automatically
- No JSON file needs to be edited manually
This is the foundation of many modern web applications.
Next tutorial: Creating API Endpoints for Specific Data (Critical Events, Devices and Statistics).
Creating API Endpoints for Specific Data
In the previous tutorial, you created an API that returned every record from the security_events table.
In this tutorial, you will create multiple API endpoints that return different types of data.
This approach is commonly used in modern web applications.
Why Create Multiple Endpoints?
Your current API returns all records:
api_events.php
This works, but many applications need smaller, more focused datasets.
For example:
api_events.php
api_critical_events.php
api_statistics.php
Each endpoint has a specific purpose.
Create a Critical Events API
Create:
api_critical_events.php
Add:
<?php

$conn = new mysqli(
    "localhost",
    "root",
    "",
    "project_db"
);

header(
    "Content-Type: application/json"
);

$query = "
    SELECT *
    FROM security_events
    WHERE severity = 'critical'
";

$result =
    $conn->query($query);

$events = [];

while (
    $row =
    $result->fetch_assoc()
) {

    $events[] = $row;

}

echo json_encode(
    $events,
    JSON_PRETTY_PRINT
);

?>
Test the Endpoint
Open:
http://localhost/api-demo/api_critical_events.php
You should only see critical events.
Screenshot Placeholder
Insert screenshot showing critical event results.
Create a Statistics API
Create:
api_statistics.php
Add:
<?php

$conn = new mysqli(
    "localhost",
    "root",
    "",
    "project_db"
);

header(
    "Content-Type: application/json"
);

$statistics = [

    "total_events" => 0,
    "critical_events" => 0,
    "high_events" => 0

];

$result =
    $conn->query(
        "SELECT COUNT(*) AS total
         FROM security_events"
    );

$statistics["total_events"] =
    $result->fetch_assoc()["total"];

$result =
    $conn->query(
        "SELECT COUNT(*) AS total
         FROM security_events
         WHERE severity='critical'"
    );

$statistics["critical_events"] =
    $result->fetch_assoc()["total"];

$result =
    $conn->query(
        "SELECT COUNT(*) AS total
         FROM security_events
         WHERE severity='high'"
    );

$statistics["high_events"] =
    $result->fetch_assoc()["total"];

echo json_encode(
    $statistics,
    JSON_PRETTY_PRINT
);

?>
Test the Statistics Endpoint
Open:
http://localhost/api-demo/api_statistics.php
Example:
{
    "total_events": 3,
    "critical_events": 1,
    "high_events": 1
}
Read the Statistics API with JavaScript
Create:
dashboard.html
Add:
<!DOCTYPE html>
<html>
<head>
    <title>Dashboard</title>
</head>
<body>

<h1>Security Dashboard</h1>

<div id="output"></div>

<script>

fetch("api_statistics.php")
    .then(response => response.json())
    .then(data => {

        document.getElementById(
            "output"
        ).innerHTML = `

            <p>
                Total Events:
                ${data.total_events}
            </p>

            <p>
                Critical Events:
                ${data.critical_events}
            </p>

            <p>
                High Events:
                ${data.high_events}
            </p>

        `;

    });

</script>

</body>
</html>
Common Endpoint Examples
Many real systems use endpoints such as:
/api/users
/api/products
/api/orders
/api/messages
/api/statistics
Each endpoint returns only the data required by the application.
Summary
You now have:
api_events.php
Returns all events.
api_critical_events.php
Returns only critical events.
api_statistics.php
Returns dashboard statistics.
This approach keeps APIs organised and makes applications easier to maintain.
Next tutorial: Adding Parameters to an API Using URL Variables.
Working with JSON Data in JavaScript
Loading JSON Data with JavaScript
In this tutorial, you will load data from a JSON file and display it on a webpage using JavaScript.
The JSON file contains information about a smart home, including devices and security events.
Create the Project Files
Create a new folder called:
json-demo
Inside the folder create:
index.html
smart_security_data.json
Copy the JSON file into the project folder.
Your folder structure should look like:
json-demo
├── index.html
└── smart_security_data.json
Create the HTML Page
Open:
index.html
Add the following code:
<!DOCTYPE html>
<html>
<head>
    <title>JSON Demo</title>
</head>
<body>

<h1>Smart Home Dashboard</h1>

<div id="output"></div>

<script src="script.js"></script>

</body>
</html>
Save the file.
Create the JavaScript File
Create a new file called:
script.js
Your folder should now look like:
json-demo
├── index.html
├── script.js
└── smart_security_data.json
Load the JSON File
Open:
script.js
Add:
fetch("smart_security_data.json")
    .then(response => response.json())
    .then(data => {

        console.log(data);

    });
Save the file.
This code loads the JSON file and converts it into a JavaScript object.
Open Developer Tools
Open:
index.html
in your browser.
Press:
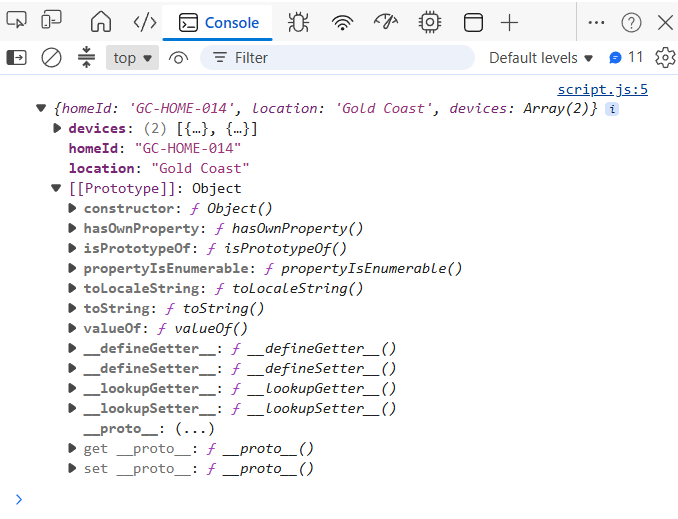
F12
and select the Console tab.
You should see the JSON data displayed.
Display the Home Information
Replace the contents of:
.then(data => {

});
with:
.then(data => {

    document.getElementById("output").innerHTML = `
        <p><strong>Home ID:</strong> ${data.homeId}</p>
        <p><strong>Location:</strong> ${data.location}</p>
    `;

});
Save the file.
Refresh the page.
You should now see:
Home ID: GC-HOME-014
Location: Gold Coast
Display the Devices
Update the code:
fetch("smart_security_data.json")
    .then(response => response.json())
    .then(data => {

        let html = `
            <p><strong>Home ID:</strong> ${data.homeId}</p>
            <p><strong>Location:</strong> ${data.location}</p>

            <h2>Devices</h2>
            <ul>
        `;

        data.devices.forEach(device => {

            html += `
                <li>
                    ${device.deviceId}
                    (${device.deviceType})
                </li>
            `;

        });

        html += "</ul>";

        document.getElementById("output").innerHTML = html;

    });
Refresh the page.
You should now see:
Home ID: GC-HOME-014
Location: Gold Coast

Devices

CAM-01 (Security Camera)
LOCK-02 (Smart Door Lock)
Complete JavaScript File
fetch("smart_security_data.json")
    .then(response => response.json())
    .then(data => {

        let html = `
            <p><strong>Home ID:</strong> ${data.homeId}</p>
            <p><strong>Location:</strong> ${data.location}</p>

            <h2>Devices</h2>
            <ul>
        `;

        data.devices.forEach(device => {

            html += `
                <li>
                    ${device.deviceId}
                    (${device.deviceType})
                </li>
            `;

        });

        html += "</ul>";

        document.getElementById("output").innerHTML = html;

    });
You have successfully loaded a JSON file and displayed data using JavaScript.
Next tutorial: Displaying JSON Data in a Table.
Displaying JSON Data in a Table
In the previous tutorial, you loaded a JSON file and displayed basic information about the smart home. In this tutorial, you will display the device data in an HTML table using JavaScript.
Current Project Structure
Your project should contain:
json-demo
├── index.html
├── script.js
└── smart_security_data.json
Create a Table Container
Open:
index.html
Update the page so it contains:
<!DOCTYPE html>
<html>
<head>
    <title>JSON Demo</title>
</head>
<body>

<h1>Smart Home Dashboard</h1>

<div id="output"></div>

<script src="script.js"></script>

</body>
</html>
The table will be generated inside the output div.
Create the Table Structure
Open:
script.js
Replace the previous code with:
fetch("smart_security_data.json")
    .then(response => response.json())
    .then(data => {

        let html = `
            <h2>Devices</h2>

            <table border="1">

                <tr>
                    <th>Device ID</th>
                    <th>Device Type</th>
                    <th>Room</th>
                </tr>
        `;

        data.devices.forEach(device => {

            html += `
                <tr>
                    <td>${device.deviceId}</td>
                    <td>${device.deviceType}</td>
                    <td>${device.room}</td>
                </tr>
            `;

        });

        html += "</table>";

        document.getElementById("output").innerHTML = html;

    });
Save the file.
View the Results
Open:
http://localhost/json-demo/
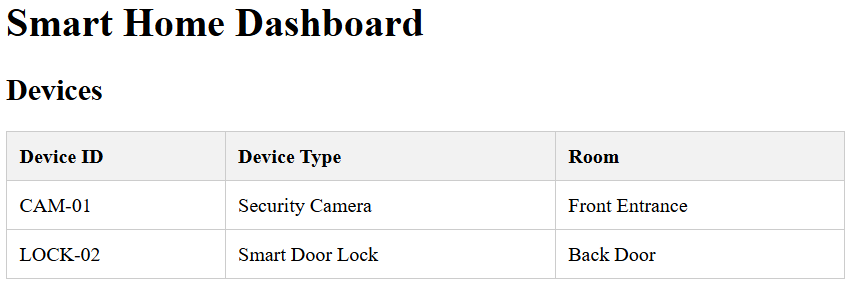
You should see:
| Device ID | Device Type | Room |
|---|---|---|
| CAM-01 | Security Camera | Front Entrance |
| LOCK-02 | Smart Door Lock | Back Door |
Add Basic Styling
The table works, but it looks very plain.
Add the following CSS inside the <head> section of index.html:
<style>

table {
    border-collapse: collapse;
    width: 100%;
}

th,
td {
    border: 1px solid #cccccc;
    padding: 10px;
    text-align: left;
}

th {
    background-color: #f2f2f2;
}

</style>
Refresh the page.
The table should now be easier to read.
Display the Home Information Above the Table
Update the start of the HTML string:
let html = `
    <p>
        <strong>Home ID:</strong>
        ${data.homeId}
    </p>

    <p>
        <strong>Location:</strong>
        ${data.location}
    </p>

    <h2>Devices</h2>

    <table border="1">

        <tr>
            <th>Device ID</th>
            <th>Device Type</th>
            <th>Room</th>
        </tr>
`;
The page should now display:
Home ID: GC-HOME-014
Location: Gold Coast

Devices
followed by the table.
Complete JavaScript File
fetch("smart_security_data.json")
    .then(response => response.json())
    .then(data => {

        let html = `
            <p>
                <strong>Home ID:</strong>
                ${data.homeId}
            </p>

            <p>
                <strong>Location:</strong>
                ${data.location}
            </p>

            <h2>Devices</h2>

            <table border="1">

                <tr>
                    <th>Device ID</th>
                    <th>Device Type</th>
                    <th>Room</th>
                </tr>
        `;

        data.devices.forEach(device => {

            html += `
                <tr>
                    <td>${device.deviceId}</td>
                    <td>${device.deviceType}</td>
                    <td>${device.room}</td>
                </tr>
            `;

        });

        html += "</table>";

        document.getElementById("output").innerHTML = html;

    });
You have successfully loaded JSON data and displayed it in an HTML table.
Next tutorial: Displaying Nested Event Data from JSON.
Displaying Nested Event Data from JSON
In the previous tutorial, you displayed device information in a table. In this tutorial, you will work with nested JSON data by displaying the security events associated with each device.
The JSON file contains devices, and each device contains its own list of events.
Understanding the JSON Structure
The JSON file contains:
Home
 └ Devices
     └ Events
Example:
{
    "deviceId": "CAM-01",
    "events": [
        {
            "eventType": "motion_detected"
        }
    ]
}
To display the events, we need to loop through:
- The devices
- The events within each device
Create an Events Table
Open:
script.js
Replace the previous code with:
fetch("smart_security_data.json")
    .then(response => response.json())
    .then(data => {

        let html = `
            <h2>Security Events</h2>

            <table border="1">

                <tr>
                    <th>Device ID</th>
                    <th>Event Type</th>
                    <th>Severity</th>
                </tr>
        `;

        data.devices.forEach(device => {

            device.events.forEach(event => {

                html += `
                    <tr>
                        <td>${device.deviceId}</td>
                        <td>${event.eventType}</td>
                        <td>${event.severity}</td>
                    </tr>
                `;

            });

        });

        html += "</table>";

        document.getElementById("output").innerHTML = html;

    });
View the Results
Open:
http://localhost/json-demo/
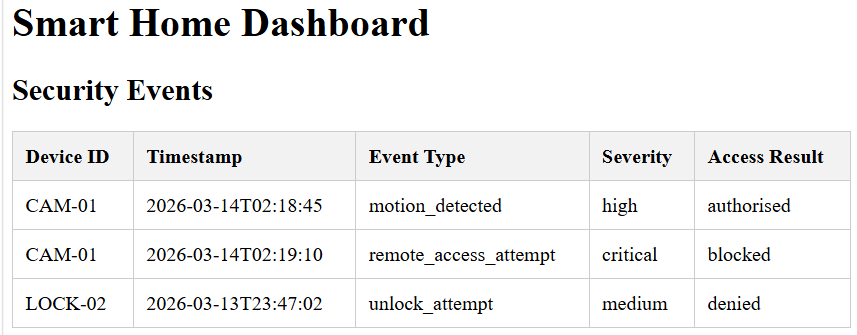
You should see a table similar to:
| Device ID | Event Type | Severity |
|---|---|---|
| CAM-01 | motion_detected | high |
| CAM-01 | remote_access_attempt | critical |
| LOCK-02 | unlock_attempt | medium |
Add Additional Event Information
The JSON file contains more information about each event.
Each event includes:
timestamp
eventType
dataTransmitted
severity
accessResult
Update the table headings:
<tr>
    <th>Device ID</th>
    <th>Timestamp</th>
    <th>Event Type</th>
    <th>Severity</th>
    <th>Access Result</th>
</tr>
Update the Table Rows
Replace the existing row code with:
html += `
    <tr>
        <td>${device.deviceId}</td>
        <td>${event.timestamp}</td>
        <td>${event.eventType}</td>
        <td>${event.severity}</td>
        <td>${event.accessResult}</td>
    </tr>
`;
Refresh the page.
The table should now display more detailed event information.
Display the Device Type
Sometimes multiple devices may generate events.
Add another column heading:
<th>Device Type</th>
Update the row:
<td>${device.deviceType}</td>
Your table will now identify which type of device generated each event.
Complete JavaScript File
fetch("smart_security_data.json")
    .then(response => response.json())
    .then(data => {

        let html = `
            <h2>Security Events</h2>

            <table border="1">

                <tr>
                    <th>Device ID</th>
                    <th>Device Type</th>
                    <th>Timestamp</th>
                    <th>Event Type</th>
                    <th>Severity</th>
                    <th>Access Result</th>
                </tr>
        `;

        data.devices.forEach(device => {

            device.events.forEach(event => {

                html += `
                    <tr>
                        <td>${device.deviceId}</td>
                        <td>${device.deviceType}</td>
                        <td>${event.timestamp}</td>
                        <td>${event.eventType}</td>
                        <td>${event.severity}</td>
                        <td>${event.accessResult}</td>
                    </tr>
                `;

            });

        });

        html += "</table>";

        document.getElementById("output").innerHTML = html;

    });
What Happened?
In the previous tutorial, you looped through a single array:
data.devices
In this tutorial, you looped through:
data.devices
and then:
device.events
This is known as a nested loop and is commonly used when working with JSON files and APIs.
You have successfully displayed nested JSON data in a table.
Next tutorial: Creating a Security Dashboard from JSON Data.
Creating a Security Dashboard from JSON Data
In the previous tutorial, you displayed individual security events in a table. In this tutorial, you will create a simple dashboard that summarises the data and highlights important security information.
The dashboard will display:
- Total Devices
- Total Events
- Critical Events
- High Severity Events
- Medium Severity Events
Using the sample JSON file, there are 2 devices and 3 events, including one critical event.
Create a Dashboard Section
Open:
script.js
Replace the existing code with:
fetch("smart_security_data.json")
    .then(response => response.json())
    .then(data => {

        let totalDevices = data.devices.length;

        let totalEvents = 0;
        let criticalEvents = 0;
        let highEvents = 0;
        let mediumEvents = 0;

        data.devices.forEach(device => {

            device.events.forEach(event => {

                totalEvents++;

                if (event.severity === "critical") {
                    criticalEvents++;
                }

                if (event.severity === "high") {
                    highEvents++;
                }

                if (event.severity === "medium") {
                    mediumEvents++;
                }

            });

        });

    });
This code calculates summary statistics from the JSON data.
Create Dashboard Cards
Below the calculations, add:
let html = `
    <h2>Security Dashboard</h2>

    <div class="card">
        <h3>Total Devices</h3>
        <p>${totalDevices}</p>
    </div>

    <div class="card">
        <h3>Total Events</h3>
        <p>${totalEvents}</p>
    </div>

    <div class="card">
        <h3>Critical Events</h3>
        <p>${criticalEvents}</p>
    </div>

    <div class="card">
        <h3>High Events</h3>
        <p>${highEvents}</p>
    </div>

    <div class="card">
        <h3>Medium Events</h3>
        <p>${mediumEvents}</p>
    </div>
`;
Display the Dashboard
Add:
document.getElementById("output").innerHTML = html;
The completed code should now display the dashboard cards.
Add Dashboard Styling
Open:
index.html
Inside the <style> section, add:
.card {
    border: 1px solid #cccccc;
    border-radius: 8px;
    padding: 15px;
    margin-bottom: 10px;
}

.card h3 {
    margin-top: 0;
}
Save the file.
View the Dashboard
Open:
http://localhost/json-demo/
Using the sample JSON file, you should see something similar to:
Security Dashboard

Total Devices: 2
Total Events: 3
Critical Events: 1
High Events: 1
Medium Events: 1
Display the Event Table Below the Dashboard
The dashboard is useful, but users often want to see the detailed events as well.
Add the following code underneath the dashboard cards:
html += `
    <h2>Security Events</h2>

    <table border="1">

        <tr>
            <th>Device ID</th>
            <th>Event Type</th>
            <th>Severity</th>
        </tr>
`;
Add Event Rows
Add:
data.devices.forEach(device => {

    device.events.forEach(event => {

        html += `
            <tr>
                <td>${device.deviceId}</td>
                <td>${event.eventType}</td>
                <td>${event.severity}</td>
            </tr>
        `;

    });

});
Close the table:
html += "</table>";
Complete JavaScript File
fetch("smart_security_data.json")
    .then(response => response.json())
    .then(data => {

        let totalDevices = data.devices.length;

        let totalEvents = 0;
        let criticalEvents = 0;
        let highEvents = 0;
        let mediumEvents = 0;

        data.devices.forEach(device => {

            device.events.forEach(event => {

                totalEvents++;

                if (event.severity === "critical") criticalEvents++;
                if (event.severity === "high") highEvents++;
                if (event.severity === "medium") mediumEvents++;

            });

        });

        let html = `
            <h2>Security Dashboard</h2>

            <div class="card">
                <h3>Total Devices</h3>
                <p>${totalDevices}</p>
            </div>

            <div class="card">
                <h3>Total Events</h3>
                <p>${totalEvents}</p>
            </div>

            <div class="card">
                <h3>Critical Events</h3>
                <p>${criticalEvents}</p>
            </div>

            <div class="card">
                <h3>High Events</h3>
                <p>${highEvents}</p>
            </div>

            <div class="card">
                <h3>Medium Events</h3>
                <p>${mediumEvents}</p>
            </div>

            <h2>Security Events</h2>

            <table border="1">

                <tr>
                    <th>Device ID</th>
                    <th>Event Type</th>
                    <th>Severity</th>
                </tr>
        `;

        data.devices.forEach(device => {

            device.events.forEach(event => {

                html += `
                    <tr>
                        <td>${device.deviceId}</td>
                        <td>${event.eventType}</td>
                        <td>${event.severity}</td>
                    </tr>
                `;

            });

        });

        html += "</table>";

        document.getElementById("output").innerHTML = html;

    });
You now have a dashboard that summarises JSON data and displays detailed event information underneath.
Next tutorial: Filtering and Highlighting Critical Security Events.